
Heart Simulator: Blood Flow and the Cardiac Cycle
Follow blood through the heart step by step, slow the cardiac cycle down, open up the beating 3D heart and see what valve disease does
Live maths
Lab notebook
Every pulse, blood pressure, stroke volume and ECG interval you measure is recorded here. Export a CSV, or turn the whole session into a PDF lab report.
| # | Heart | Time | Measured | Value | Notes |
|---|
Concept library
Click "New problem" to begin.
Click "Start quiz" for 5 questions: calculations, the cardiac cycle and the ECG.
1 Overview
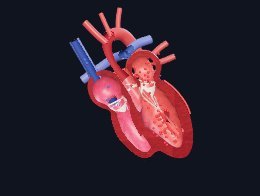
A human heart that beats from a model of the whole circulation: four chambers that fill and empty, four valves that open and shut on the pressures either side of them, arteries that stretch, and veins that bring the blood back. Beside it, the graphs that come out of the same model: a Wiggers diagram (ECG, pressures, volume and heart sounds), the ECG on grid paper, the pressure–volume loop and the double circulation. Every number is checked against textbook physiology.
It has three modes: Simulate (the heart with all its learning aids and a concept library), Experiment (six practicals you carry out and write up as a PDF lab report) and Quiz (a practice quiz with worked solutions, then a 5-question quiz). The units switch shows pressures in kPa (as UK courses use) or mmHg (as US medicine uses). Volumes are in mL in both.
2 Getting started
- The heart opens in 2D, cut open through all four chambers. The 2D | 3D switch changes it any time and remembers your choice. Drag the 3D heart to turn it.
- Pick a view at the top of the heart: Outside, 4 chambers (cut open), Slice (across both ventricles), Valves (from above) or Electrical (the conduction system).
- Slow the heart down with the speed buttons under it (½×, ⅕× or Slow), or pause it and press ⏭ to step through the cycle one phase at a time. The coloured strip and the name show which phase you are in.
- Choose a condition in the command bar (or the Condition panel) and watch what changes in the heart and on the graphs.
3 The views
- Outside: the ventricles, atria and auricles, the coronary arteries and veins in their grooves of fat, and the great vessels: aorta, pulmonary artery, venae cavae and pulmonary veins.
- 4 chambers in 2D is a teaching diagram rather than an anatomical one. The right side is blue (low in oxygen), the left red (rich in oxygen), the septum keeps them apart, and the lungs and body close the figure of eight round the heart. The blood flows as a liquid, valves show open or shut, LUB and DUB pop as valves close, and the chambers that are squeezing say contracting. Switch on Follow a drop to send one glowing drop all the way round in eleven numbered steps, with a caption for each. It waits behind every closed valve like the rest of the blood.
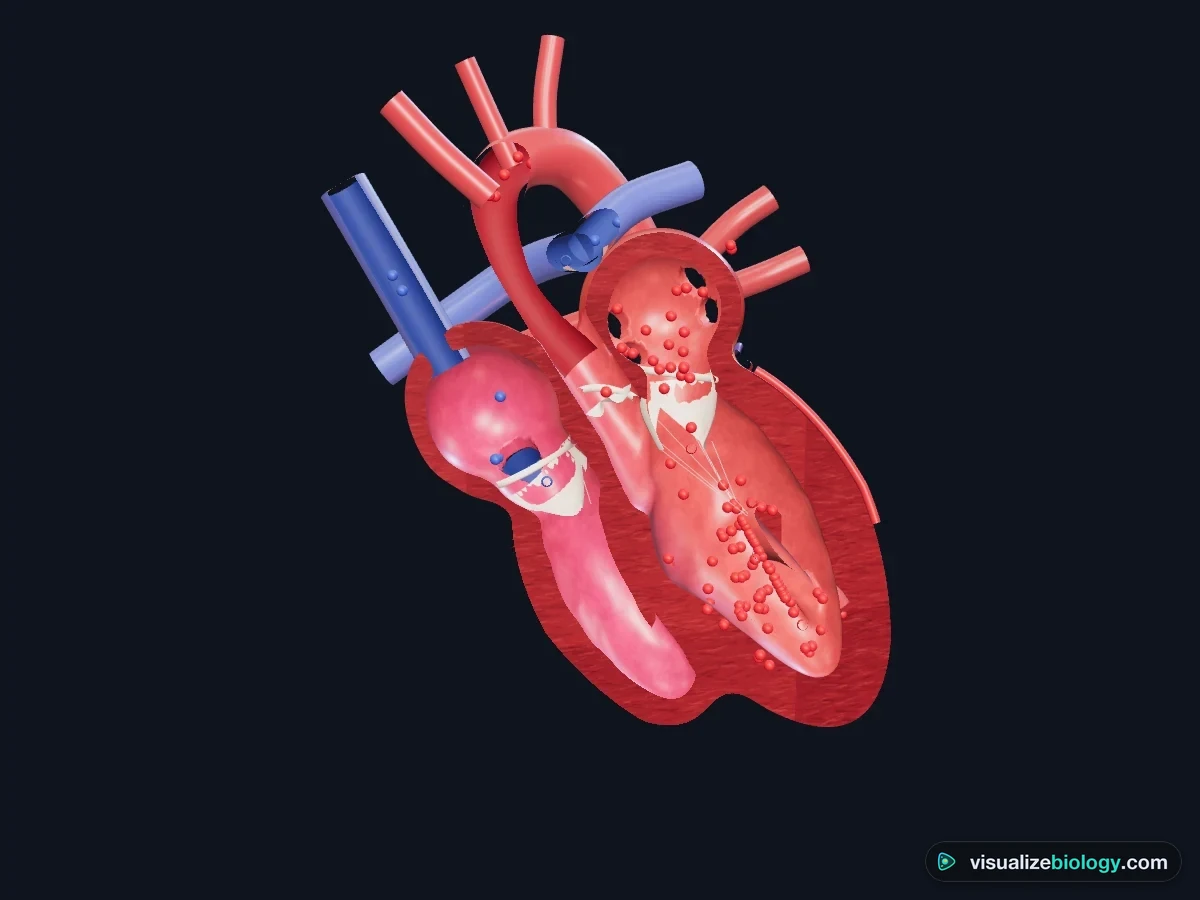
- 4 chambers in 3D: the heart cut down through all four chambers. Blood (blue in the right side, red in the left) is held back by closed valves, then rushes through when they open. The tendons (chordae tendineae) tie the mitral and tricuspid valves to the papillary muscles.
- Slice: a cross-section of both ventricles. The thick round left ventricle and the thin crescent of the right ventricle; watch the walls thicken as they contract.
- Valves: the base of the heart with the atria lifted off: tricuspid and mitral (atrioventricular) valves, aortic and pulmonary (semilunar) valves.
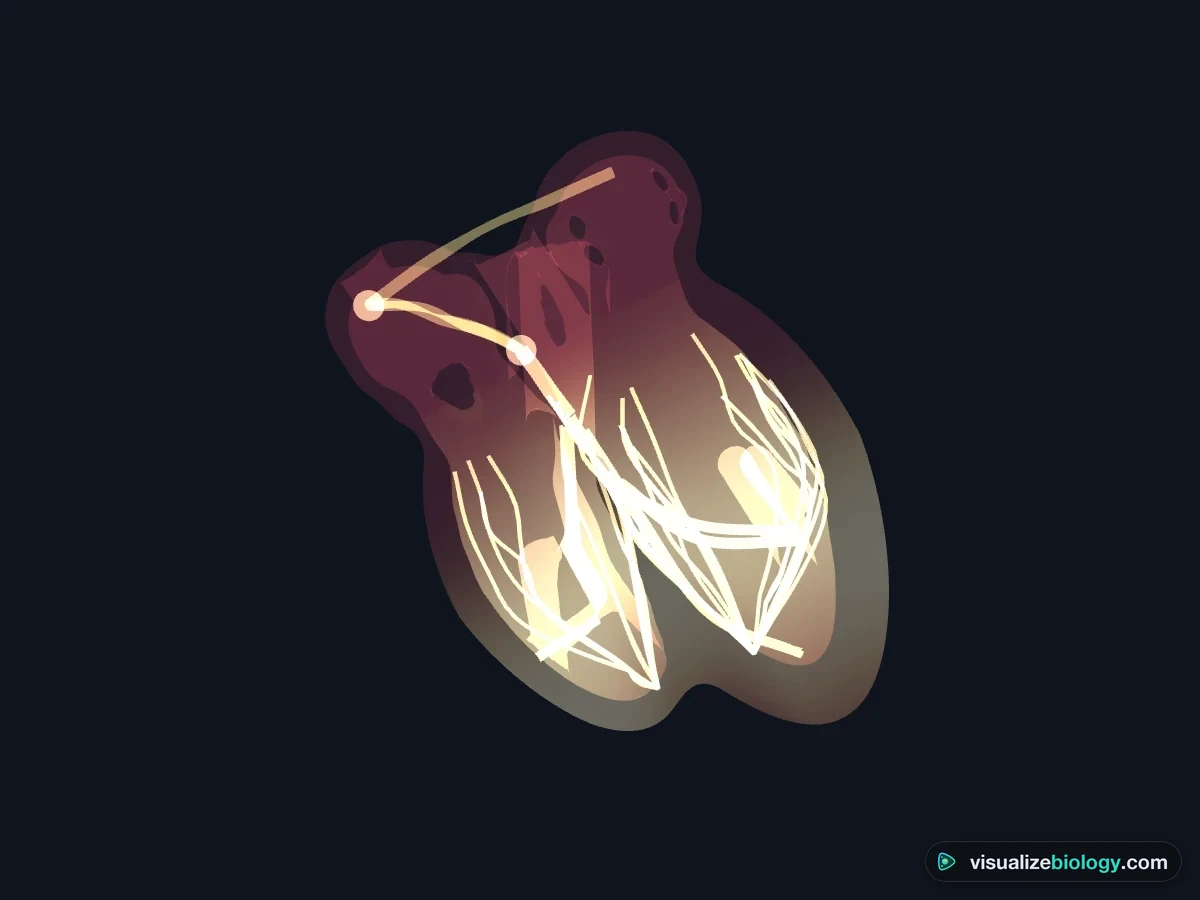
- Electrical: the heart becomes glass and the conduction system lights up: the SA node, the wave across the atria, the delay at the AV node, the bundle of His, the bundle branches and the Purkinje fibres.
- Labels names every part; Blood flow shows or hides the blood. Hover over any part for its name and live pressure and volume. Split switches between the heart beside the graphs and the heart on its own.
4 The graphs
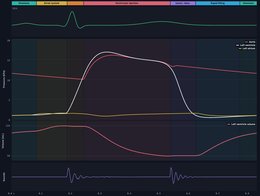
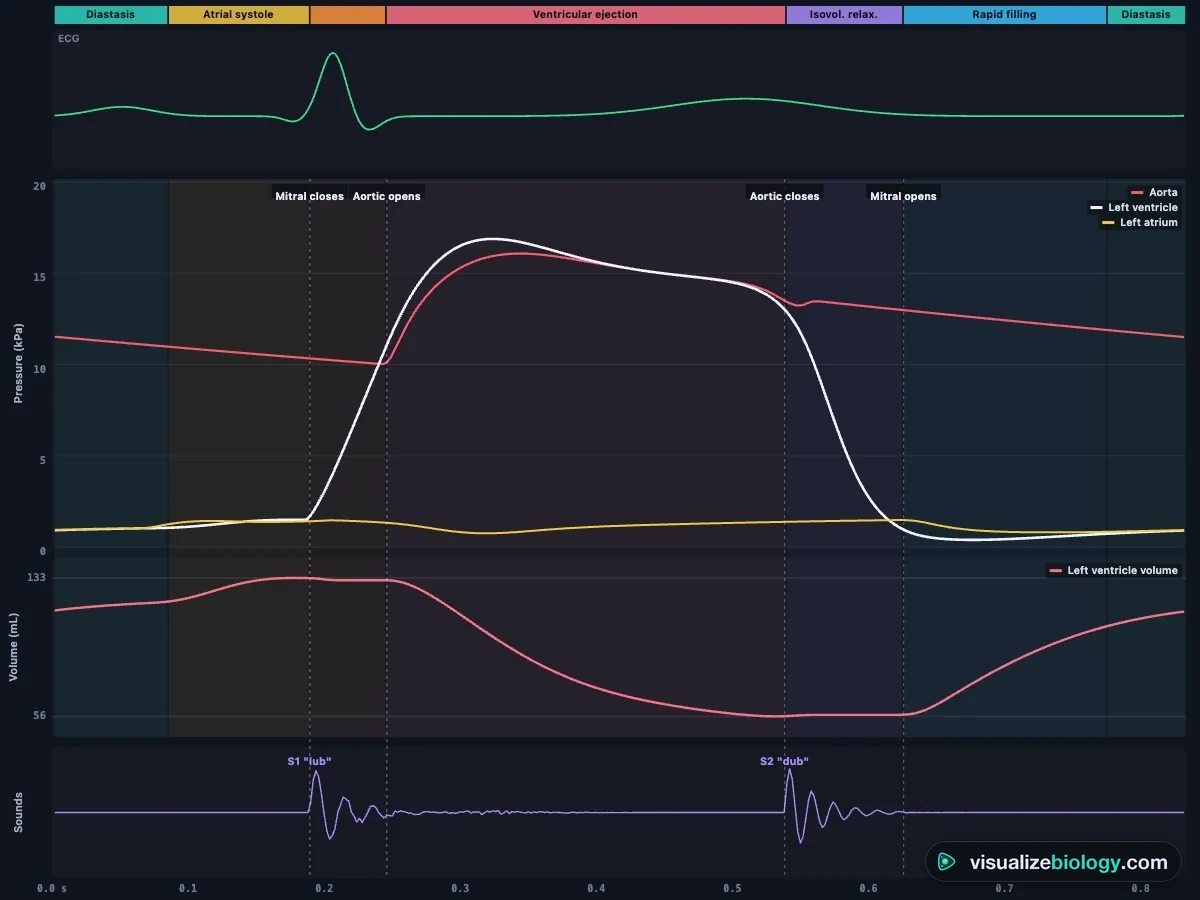
- Wiggers: one heartbeat from left to right, redrawn as it happens. The coloured band names each phase; dashed lines mark the valves opening and closing; S1 and S2 sit under the valve closures. Hover for exact values. Left heart shows aorta, left ventricle and left atrium; Right heart shows pulmonary artery, right ventricle and right atrium.
- ECG: lead II at 25 mm/s on grid paper. Click two points to measure an interval with the calipers; the heart rate is 60 ÷ the R–R interval.
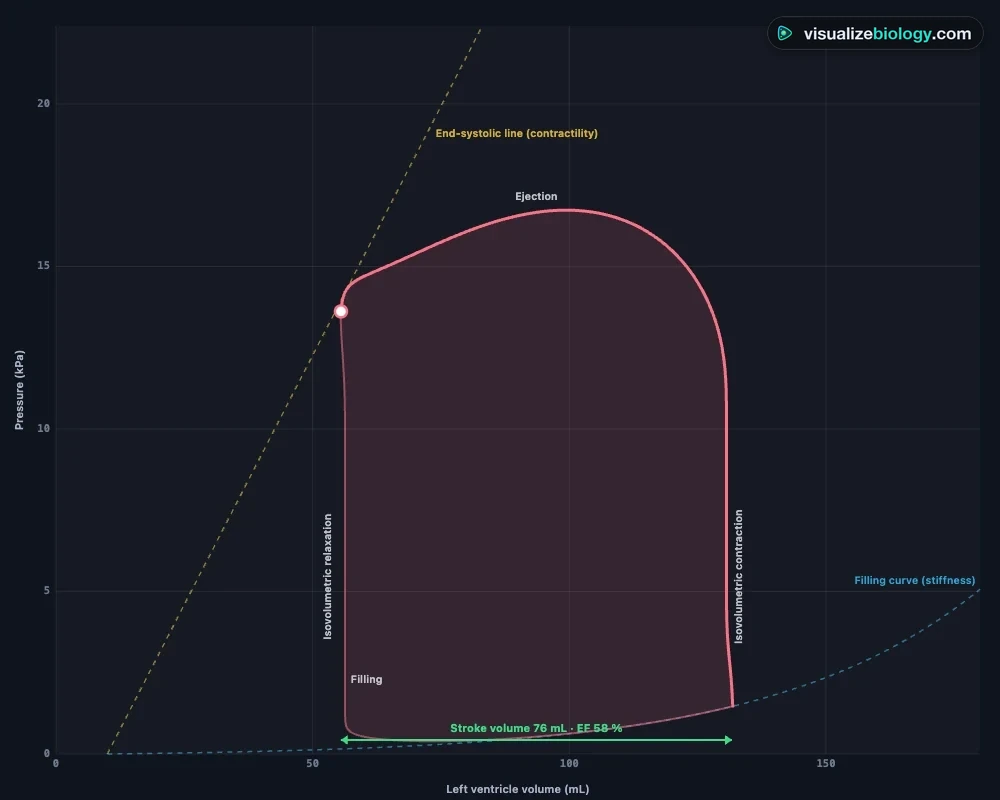
- PV loop: pressure against volume for each beat. Its width is the stroke volume. The gold line is the end-systolic pressure–volume relation (contractility), the blue curve is the filling curve (stiffness).
- Circulation: the double circulation, with blood pressures and the cardiac output.
- Status (or key S): heart rate, blood pressure, cardiac output, stroke volume, ejection fraction and left atrial pressure.
5 Rate, strength and conditions
The Heart panel sets the heart rate (40 to 180 per minute), contractility, blood volume and the resistance of the blood vessels. The Condition panel switches to exercise, high blood pressure, four valve diseases, a hole in the heart, a heart attack, heart failure, atrial fibrillation or complete heart block, each with what to look for. Conditions are educational models of typical cases, not medical advice.
6 Listening
Switch on Heart sounds in the Listen panel (headphones help) and choose where to put the stethoscope: aortic, pulmonary, tricuspid or mitral area. You hear S1 and S2, the extra sounds S3 and S4 where a condition causes them, and murmurs from turbulent flow, loudest where they are heard in a real examination.
7 Experiment mode and the lab report
Six practicals: a heart dissection (identify the parts, cut it open, measure the walls), pulse rate and exercise, reading an ECG, pressure changes in the cardiac cycle, stroke volume and Starling's law, and a diagnosis case where you examine an unknown patient. Each shows its aim, what you need and a real-lab safety note; the method ticks off as you work. Answer the conclusion question, then press Create lab report for a PDF. The graph labels and the healthy reference loop are switched off in Experiment mode.
8 Quiz
The practice quiz covers heart rate from an ECG, cardiac output, stroke volume and ejection fraction, the phases and valves of the cardiac cycle, heart sounds, the conduction system and the conditions. Pick a topic, answer, press Check, and Show solution for a worked answer. Then Take the quiz: 5 mixed questions and a 0–3 star rating.
9 Keyboard and gestures
- Space plays or pauses, N steps to the next phase, 1–5 choose the view, L labels, W, E, P and C pick the graph, S opens Status.
- Scrolling over the 3D heart always scrolls the page. To zoom the heart, hold Ctrl (⌘ on a Mac) and scroll, pinch the trackpad, or click the heart first.
- On a phone, switch Heart / Graphs at the top of the lab, or tap the small picture to swap. The controls live in the deck at the bottom of the screen: Heart, Condition, Listen and Measure.
A 3D heart simulator for the cardiac cycle, with the Wiggers diagram, ECG and heart conditions
This heart simulator is a free, browser-based model of the human heart that beats from the physics of the whole circulation. The four chambers fill and empty, the valves open and close on the pressures either side of them, and the same run draws the Wiggers diagram, the ECG and the pressure–volume loop beside it. You can turn the 3D heart round, cut it open through the four chambers or across the ventricles, look down on the valves, and watch the wave of electrical activity spread from the SA node to the Purkinje fibres.
- Views
- Outside, four-chamber section, short-axis slice, valves from above, conduction system
- Graphs
- Wiggers diagram, ECG with calipers, pressure–volume loop, double circulation
- Controls
- Heart rate, contractility, blood volume, vascular resistance, speed down to one twelfth
- Conditions
- Exercise, hypertension, aortic and mitral stenosis and regurgitation, VSD, heart attack, heart failure, atrial fibrillation, heart block
- Model
- Time-varying elastance chambers, Bernoulli valves with inertia, Windkessel arteries
- Modes
- Simulate, Experiment (6 practicals) and Quiz
- Runs on
- Any modern browser, including Chromebooks, tablets and phones. Opens in 2D; 3D one click away.
- Price
- Free, with no account or download
Blood flow through the heart, step by step
Switch the heart to 2D and turn on Follow a drop to watch one drop of blood make the whole journey, with each step named as it happens. In order:
- Blood low in oxygen returns from the body through the superior and inferior vena cava into the right atrium.
- The right atrium contracts and blood passes through the tricuspid valve into the right ventricle.
- The right ventricle contracts. The tricuspid valve shuts ("lub") and blood goes through the pulmonary valve into the pulmonary artery.
- In the lungs the blood picks up oxygen and gives up carbon dioxide.
- Blood rich in oxygen returns through the pulmonary veins into the left atrium.
- The left atrium contracts and blood passes through the mitral (bicuspid) valve into the left ventricle.
- The thick left ventricle contracts. The mitral valve shuts and blood goes through the aortic valve into the aorta, then round the body. The semilunar valves shutting make the "dub".
This is double circulation: blood passes through the heart twice on every trip round the body, once on the way to the lungs (the pulmonary circuit) and once on the way to the body (the systemic circuit). The septum, a solid wall of muscle, keeps the right side (low in oxygen, blue in diagrams) apart from the left side (rich in oxygen, red), so the two never mix, and the valves keep each side flowing one way. The step-by-step order is on the GCSE, IGCSE, CBSE Class 10 and 11, NEET, AP Biology and IB Biology courses; the pressures, the Wiggers diagram and the pressure–volume loop below go on to university physiology.
The cardiac cycle, phase by phase
One heartbeat at 72 beats per minute lasts about 0.8 seconds. The atria and ventricles contract (systole) and relax (diastole) in turn, and blood only ever moves from higher to lower pressure. The valves make sure it moves one way.
| Phase | Valves | What happens |
|---|---|---|
| Atrial systole | Atrioventricular open, semilunar closed | The atria contract and push the last 20 % or so of blood into the ventricles |
| Isovolumetric contraction | All four closed | The ventricles start to contract; pressure rises fast but no blood moves. The atrioventricular valves closing make S1, "lub" |
| Ejection | Semilunar open | Ventricular pressure exceeds the arteries'; about 70 mL leaves each ventricle |
| Isovolumetric relaxation | All four closed | The ventricles relax; the semilunar valves closing make S2, "dub" |
| Filling | Atrioventricular open | Ventricular pressure falls below atrial pressure and blood rushes in, then slows |
Pressure changes and the valves
Exam questions on the cardiac cycle come down to one rule: a valve opens when the pressure behind it is higher than the pressure in front of it. In the left heart the peak pressure is about 16 kPa (120 mmHg) and the aorta never falls much below 10.7 kPa (80 mmHg), because its elastic wall recoils between beats. The right ventricle only needs about 3.3 kPa (25 mmHg) to push blood through the lungs, which is why its wall is thinner. Heart rate × stroke volume gives the cardiac output, about 5 litres per minute at rest and three times that in hard exercise.
The heart's electrical system and the ECG
Heart muscle is myogenic: it starts its own beat. The sinoatrial (SA) node in the right atrium fires; a wave of depolarisation spreads across both atria (the P wave) and they contract. A layer of non-conducting tissue stops it reaching the ventricles directly, so it passes through the atrioventricular (AV) node, which delays it about 0.1 s so the atria finish emptying. The bundle of His and the bundle branches carry it down the septum to the apex, and the Purkinje fibres spread it up the ventricle walls, so the ventricles contract from the bottom up (the QRS complex). The T wave is the ventricles repolarising.
Stroke volume, ejection fraction and the pressure–volume loop
Plot the left ventricle's pressure against its volume and each beat traces a loop. The bottom edge is filling, the right edge isovolumetric contraction, the top ejection and the left edge isovolumetric relaxation. The loop's width is the stroke volume (end-diastolic minus end-systolic volume); stroke volume ÷ end-diastolic volume is the ejection fraction, normally 55 to 70 %. Fill the heart with more blood and it pumps more out: Starling's law of the heart.
Heart conditions you can simulate
| Condition | What goes wrong | What to look for |
|---|---|---|
| Aortic stenosis | A stiff, narrow aortic valve | Left ventricular pressure far above aortic pressure; a loud murmur in systole; a thick ventricle wall |
| Aortic regurgitation | The aortic valve leaks | Blood falling back into the ventricle in diastole; a wide pulse pressure; a large ventricle |
| Mitral stenosis | A narrow mitral valve | High left atrial pressure, a big left atrium, a rumbling murmur in diastole |
| Mitral regurgitation | The mitral valve leaks | Blood jetting back into the atrium in systole, a tall atrial wave, a murmur through all of systole |
| Hole in the heart (VSD) | A gap in the septum | Blood crossing from the left ventricle to the right; extra blood to the lungs |
| Heart attack | Part of the wall has lost its blood supply | A patch that does not contract, ST elevation on the ECG, a lower ejection fraction |
| Heart failure | A weak, enlarged left ventricle | Ejection fraction about 20 %, high filling pressures, a third heart sound |
| Atrial fibrillation | The atria quiver | No P waves, an irregularly irregular pulse, no atrial kick |
| Complete heart block | No signal crosses the AV node | P waves and QRS complexes at their own rates, a pulse near 38 per minute |
These are educational models of typical cases, built from textbook physiology. They are not medical advice and cannot diagnose anyone.
Practicals and course links
| Experiment | What you find out | Course links |
|---|---|---|
| Heart dissection | The chambers, valves, tendons and vessels; why the left wall is thicker | GCSE, IGCSE, A-level, NEET |
| Pulse rate and exercise | How heart rate rises in exercise and recovers | GCSE, IGCSE, AP Biology |
| Reading an ECG | Heart rate from the R–R interval; the PR interval; abnormal rhythms | A-level (AQA, OCR), IB |
| Pressure changes in the cardiac cycle | When and why each valve opens and closes | A-level, NEET |
| Stroke volume and Starling's law | Cardiac output, ejection fraction, preload | A-level, IB, college physiology |
| Diagnose the patient | Linking murmurs, pressures and ECGs to a diagnosis | A-level extension, college physiology |
Who uses this heart simulator?
Students use it to see what the textbook diagrams cannot show: a heart that moves, valves that open and close in the right order, and graphs that line up with them. Teachers project it to explain the Wiggers diagram one phase at a time, use the dissection practical when real hearts are not possible, and set the ECG practical as homework. It needs no login, so it works on school Chromebooks, and the share bar has a QR code for the classroom.
Frequently asked questions
What is the order of blood flow through the heart?
Body → venae cavae → right atrium → tricuspid valve → right ventricle → pulmonary valve → pulmonary artery → lungs → pulmonary veins → left atrium → mitral (bicuspid) valve → left ventricle → aortic valve → aorta → body. The right side pumps blood low in oxygen to the lungs; the left side pumps blood rich in oxygen to the body.
Why don't oxygenated and deoxygenated blood mix in the heart?
The septum, a wall of muscle between the left and right sides, keeps them apart, and each side has its own pair of valves that only let blood go one way. If there is a hole in the septum (a septal defect) the blood does mix; you can switch one on under Condition to see it.
What is double circulation?
In double circulation the blood passes through the heart twice for each complete trip round the body: the right side sends it through the lungs (pulmonary circulation) and the left side sends it round the body (systemic circulation). Keeping the two apart lets the left ventricle pump blood to the body at high pressure while the lungs receive it at low pressure.
What are the stages of the cardiac cycle?
The cardiac cycle has three main stages: atrial systole (the atria contract and top up the ventricles), ventricular systole (the ventricles contract, the atrioventricular valves close and blood is pushed into the aorta and pulmonary artery) and diastole (the heart muscle relaxes and the chambers fill). In more detail, ventricular systole is split into isovolumetric contraction and ejection, and diastole into isovolumetric relaxation, rapid filling and slow filling.
What makes the heart valves open and close?
Pressure differences. A valve opens when the pressure behind it is higher than the pressure in front of it, and shuts when the pressure difference reverses. The aortic valve opens when pressure in the left ventricle rises above pressure in the aorta, and closes when it falls below it again. The mitral valve closes as soon as ventricular pressure exceeds atrial pressure.
What causes the lub-dub sounds of the heart?
The first sound, lub (S1), is made by the mitral and tricuspid valves closing at the start of ventricular systole. The second sound, dub (S2), is made by the aortic and pulmonary valves closing at the start of diastole. A murmur is the sound of turbulent blood flow, for example through a narrowed or leaking valve.
Why is the wall of the left ventricle thicker than the right?
The left ventricle pumps blood all round the body against a high pressure, about 16 kPa (120 mmHg) at its peak. The right ventricle only pumps blood to the lungs, next door, at about 3 kPa (25 mmHg). The left ventricle needs more muscle to produce the higher pressure, so its wall is about three times as thick.
What does an ECG show?
An electrocardiogram records the electrical activity of the heart. The P wave is atrial depolarisation, the QRS complex is ventricular depolarisation and the T wave is ventricular repolarisation. The PR interval includes the delay at the atrioventricular node. Heart rate is 60 divided by the time between two R waves in seconds.
How do you calculate cardiac output?
Cardiac output = heart rate × stroke volume. At rest, 72 beats per minute × 70 mL per beat = 5040 mL, about 5 litres per minute. Stroke volume is end-diastolic volume minus end-systolic volume, and ejection fraction is stroke volume divided by end-diastolic volume, normally 55 to 70 %.
What happens to the heart in atrial fibrillation?
In atrial fibrillation the atria quiver chaotically instead of contracting, so there are no P waves on the ECG and the atria no longer top up the ventricles. Impulses reach the ventricles at random, so the pulse is irregularly irregular. This simulator shows it as an educational model; it is not medical advice.
What is the difference between a pacemaker and the SA node?
The sinoatrial (SA) node is the heart's natural pacemaker: a patch of cells in the wall of the right atrium that starts each heartbeat. Heart muscle is myogenic, so it beats without nervous stimulation. An artificial pacemaker is a device that takes over when the natural system fails, for example in complete heart block.
Can I use this simulator instead of a heart dissection?
It is a good way to prepare for, revise or replace a dissection when one is not possible. The heart dissection practical walks you through the outside of the heart, the cut through the four chambers, the valves and the wall thickness. It does not replace hands-on lab work where your course requires it.
Explore related simulators
Open up another organ in 2D and 3D in the Human Eye Simulator: follow light to the retina and watch the lens focus. See the brain that uses a fifth of the blood the heart pumps, and what happens when one of its arteries is blocked, in the interactive 3D brain model. See the rib cage and sternum that protect the heart, and every other bone, in the Interactive 3D Skeleton. Compare an open circulation, where a 13-chambered tube pumps colourless haemolymph, in the Virtual Cockroach Dissection. Look at heart muscle and blood cells down the Virtual Microscope, and see why red blood cells burst in water in the Osmosis Lab. For engineering and physical-science simulators, including fluid flow and pumps, see our sister site MechSimulator. See how the ear hears and keeps your balance in the Human Ear Simulator. Follow a meal from the mouth to the blood that this heart pumps in the Human Digestive System Simulator. Follow the fifth of every heartbeat that goes to the kidneys, and how they filter it into urine, in the Kidney Simulator. Follow the oxygen this heart carries away from the alveoli, and the carbon dioxide it brings back to them, in the Respiratory System Simulator. Compare it with a frog's three-chambered heart, beating in the body cavity, in the Virtual Frog Dissection.
Sources: OpenStax Anatomy and Physiology 2e, chapter 19; Klabunde, Cardiovascular Physiology Concepts (3rd ed., 2021); Hall, Guyton and Hall Textbook of Medical Physiology (14th ed., 2020); Suga & Sagawa, "Instantaneous pressure-volume relationships and their ratio in the excised, supported canine left ventricle", Circ. Res. 35 (1974); Mynard et al., "A simple, versatile valve model", Int. J. Numer. Meth. Biomed. Eng. 28 (2012); AQA GCSE Biology (8461) and A-level Biology (7402) specifications. This is an educational model, not medical advice.
Updated