
Osmosis Lab
A free virtual lab in 3D: watch water cross a membrane, push it back with reverse osmosis, then test it on potato cores, the naked egg and red blood cells
Live maths
Lab notebook
Every mass, length, absorbance and finished experiment is recorded here. Export a CSV, or turn the whole session into a PDF lab report.
| # | Sample | Time | Measured | Value | Notes |
|---|
Concept library
Click "New problem" to begin.
Click "Start quiz" for 5 questions: calculations, predictions and graphs.
1 Overview
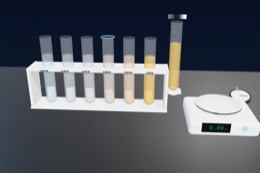
Simulate is the fundamentals: an osmosis chamber with pure water and salt water either side of a partially permeable membrane, and a piston for reverse osmosis. Experiment applies it to living things, with three specimens. Potato cores: cut cores, soak them in a dilution series of sucrose or salt, blot and reweigh, and plot the percentage change in mass to find where the tissue neither gains nor loses water. Egg: dissolve the shell in vinegar, then watch the naked egg swell in distilled water and shrink in corn syrup. Red blood cells: put blood into saline from 0 to 2 %, then centrifuge, read the colorimeter and look at the cells, to see haemolysis and crenation. Every number comes from a water-potential model checked against textbook values.
It has three modes: Simulate (a free lab with learning aids and a concept library), Experiment (seven practicals you carry out by hand and write up as a PDF lab report) and Quiz (a practice quiz with worked solutions, then a 5-question quiz with a star rating). The Units switch shows masses, lengths, temperatures and water potentials in SI (g, mm, °C, MPa) or Imperial (oz, in, °F, psi). Concentrations stay in mol/dm³ and % w/v in both.
2 Getting started
- The bench opens in 3D on a computer or tablet and in 2D on a phone. The 2D | 3D switch changes it any time and remembers your choice.
- Simulate opens on the osmosis chamber. Press ▶ Start osmosis and watch side B (salt water) fill while side A (pure water) empties. Then press 💪 Apply pressure for reverse osmosis.
- For the biology practicals, open Experiment and choose one. In the potato practical, press ✂ Cut & weigh cores, then ⬇ Put cores in the tubes.
- Start the lab clock (▶ in the command bar, the Time panel, or the Space key). It stops by itself at the time you choose (24 h by default). One second can be one minute, ten minutes or an hour.
- Press ⚖ Remove, blot & weigh. Your results go into the lab notebook and onto the graph.
2b Simulate: osmosis and reverse osmosis
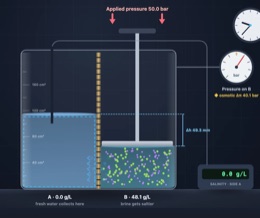
- Setup: choose what is on each side (pure water, 5 or 20 g/L on A; 10, 35 or 60 g/L on B), salt or sugar, and the membrane: partially permeable, or one that lets salt through.
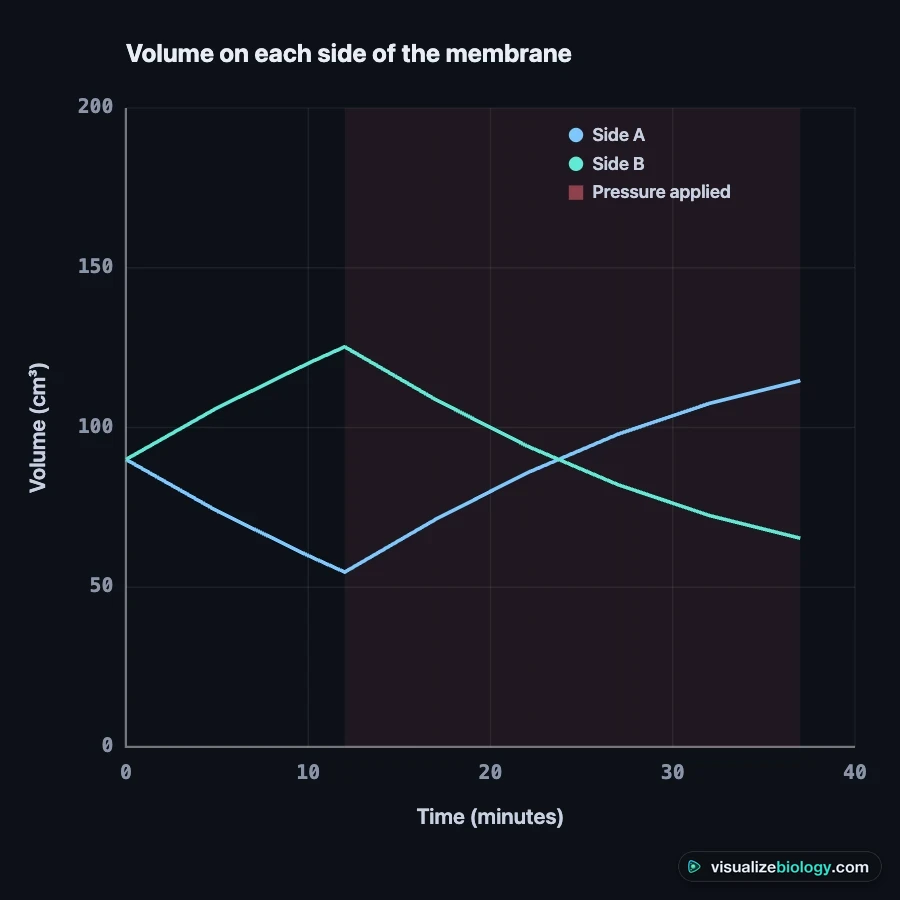
- Particles shows the membrane close up: water molecules crossing through aquaporin channels both ways, the salt ions that cannot, and the net flow. Graph plots the volume on each side against time.
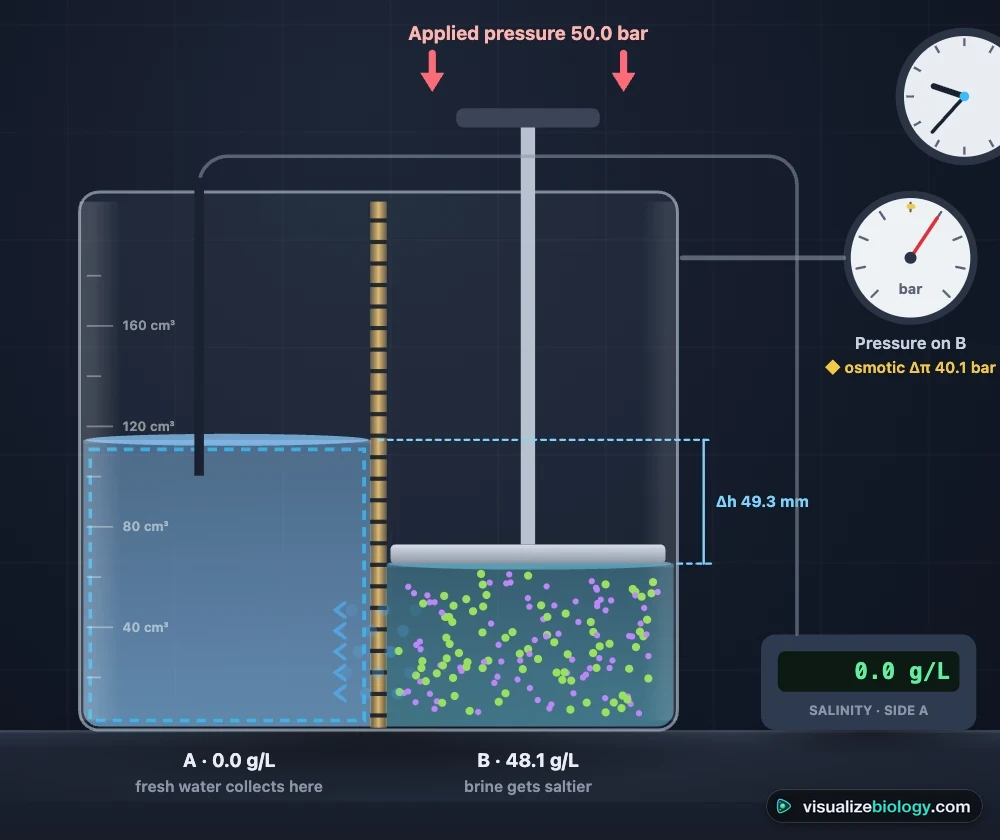
- Conditions: switch on Reverse osmosis and set the pressure on side B (0 to 80 bar). The gauge's red needle is the applied pressure; the gold mark is the osmotic pressure difference it must beat.
- Measure: read the salinity of either side or record the volumes in the lab notebook.
3 The bench and the observe view
- Select a sample: click a tube on the bench (or a chip under the observe view). The observe view and the Status readings follow it.
- Cells: the selected sample's cells. Potato cells turn turgid, flaccid or plasmolysed; the egg shows its membrane and contents; red blood cells appear under a 400× microscope as discs, swollen spheres, crenated cells or burst "ghosts".
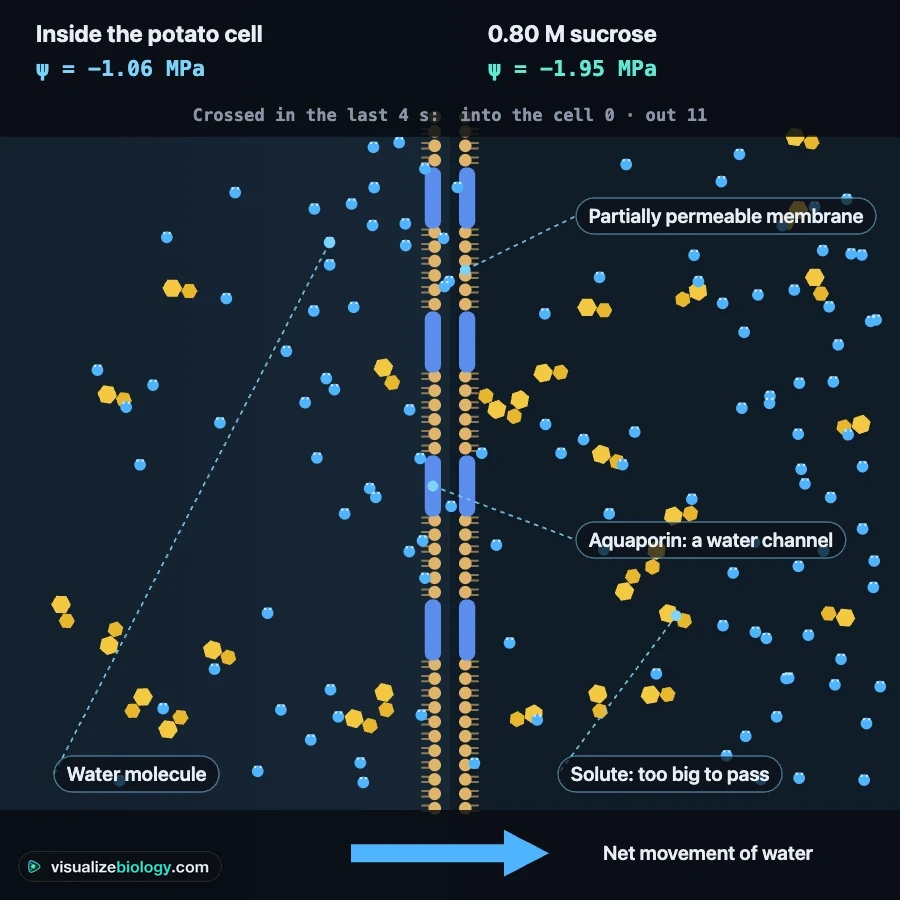
- Particles: water molecules crossing a partially permeable membrane between the cell and the solution, with the solute molecules that cannot pass. The arrow shows the net movement of water, from higher to lower water potential.
- Graph: percentage change in mass against concentration (potato), mass against time (egg), or haemolysis against NaCl concentration (red cells). Curve of best fit adds the fitted curve and reads off the isotonic point.
- Status (top-right of the observe view, or key S): the water potential of the cells and of the solution, which way water is moving, the change in mass, the turgor pressure and the state of the cells.
- Water arrows show the direction of osmosis on the bench. Label apparatus names every piece of equipment.
4 Potato cores
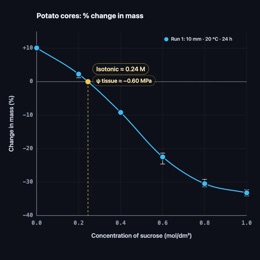
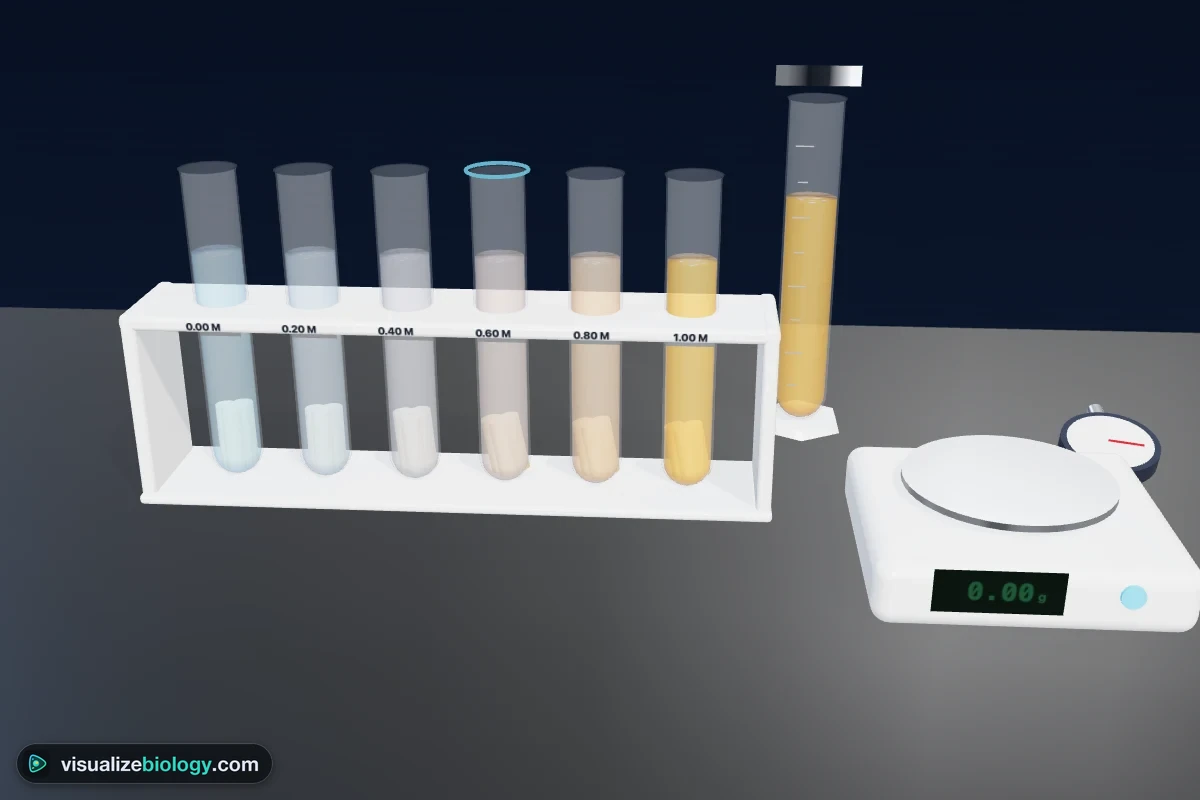
- Setup: sucrose or salt, the concentration in each of the six tubes (type your own, or pick a 0–1.0 M or 0–0.5 M series) and one or three cores per tube.
- Conditions: temperature, the cork borer (5 to 13 mm) and the core length. Thinner cores have a larger surface area to volume ratio, so they reach equilibrium sooner.
- Measure: weigh the selected tube's cores at any time (they go back into the tube afterwards), measure their length, or remove, blot and weigh them all. Switch off Blot before weighing to see how surface liquid adds a systematic error.
- Above about 45 °C the cell membranes are damaged, so the cores stop behaving as osmometers.
5 Egg
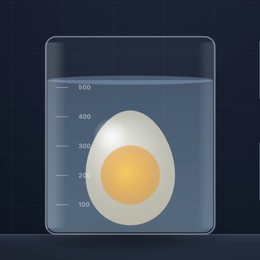
Put the egg into vinegar and run the clock: carbon dioxide bubbles as the ethanoic acid dissolves the calcium carbonate shell (about a day at 20 °C). Then move the naked egg into distilled water, corn syrup or 10 % salt by clicking a bottle on the bench or a liquid in the Setup panel. Weigh it and measure its circumference as often as you like; the graph shows mass against time with each liquid shaded.
6 Red blood cells
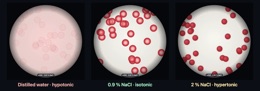
Eight tubes hold saline (or urea) from 0 to 2 %. Press 💉 Add blood, let the clock run for 30 minutes, then 🌀 Centrifuge and 📟 Read the colorimeter for each tube's absorbance at 540 nm. The haemolysis graph turns absorbance into percentage haemolysis using the tube in distilled water as 100 %. Burst cells release haemoglobin, so a tube with lysed cells is clear red (you can read the card behind it) while intact cells make it cloudy. The Cells view shows each tube under the microscope.
7 Experiment mode and the lab report
Pick one of seven experiments: potato cores in sucrose (GCSE), the water potential of potato tissue (A-level), surface area and the rate of osmosis, temperature and the rate of osmosis, the naked egg, red blood cells under the microscope, and the osmotic fragility test. Each shows its aim, what you need and a real-lab safety note. The method ticks off as you do each step, a timer runs, and your results go into the lab notebook. Answer the conclusion question from your own results, then press Create lab report for a PDF with your results table, graph, calculations and sources of error. The particle view and the curve of best fit are switched off in Experiment mode.
8 Quiz
The Quiz tab opens on the practice quiz: percentage change, ψs = −iCRT, reading the isotonic point from a graph, predicting which way water moves, surface area to volume ratio, and identifying cells in pictures. Pick a topic, answer, press Check, and Show solution for a worked answer. Then choose Take the quiz: 5 mixed questions and a 0–3 star rating.
9 Keyboard and gestures
- Space starts or pauses the clock, S opens Status, 1–8 select a tube, G, C and P switch the observe view to Graph, Cells or Particles.
- Scrolling over the 3D bench always scrolls the page. To zoom the bench, hold Ctrl (⌘ on a Mac) and scroll, pinch the trackpad, or click the bench first.
- On a phone, switch Bench / Observe at the top of the lab, or tap the small picture to swap. The controls live in the deck at the bottom of the screen: Setup, Time, Conditions and Measure.
Osmosis and reverse osmosis simulator, with potato, egg and red blood cell practicals
This osmosis lab is a free, browser-based simulation that starts with the physics of osmosis and reverse osmosis across a membrane, then moves to the three osmosis experiments every biology course uses. You cut potato cores and soak them in a sucrose dilution series, dissolve the shell of an egg and watch it swell and shrink, and put red blood cells into saline until they crenate or burst. Masses, volumes and rates come from a water-potential model, so the results behave like real ones: they scatter a little, depend on time, temperature and core size, and give a graph you can analyse.
- Specimens
- Potato tissue, a de-shelled hen's egg, and red blood cells
- Solutions
- Sucrose and NaCl from 0 to 1.0 mol/dm³; saline and urea from 0 to 2 %; vinegar, corn syrup and 10 % salt
- Variables
- Concentration, solute, time, temperature, core diameter and length
- Measurements
- Mass to 0.01 g, length, egg circumference, absorbance at 540 nm, cell shape at 400×
- Model
- ψ = ψs + ψp with ψs = −iCRT; Boyle–van 't Hoff volumes for red cells
- Modes
- Simulate, Experiment (7 practicals) and Quiz
- Runs on
- Any modern browser, including Chromebooks, tablets and phones. 3D on larger screens, 2D on phones.
- Price
- Free, with no account or download
What is osmosis?
Osmosis is the net movement of water molecules from a region of higher water potential to a region of lower water potential through a partially permeable membrane. A dilute solution has more free water molecules than a concentrated one, so water moves from the dilute side to the concentrated side. Water molecules still cross in both directions; osmosis is the difference between the two flows. The particle view in the lab shows exactly this, with solute molecules too large to pass the membrane.
| Solution outside the cell | Water moves | Plant cell | Animal cell (red blood cell) |
|---|---|---|---|
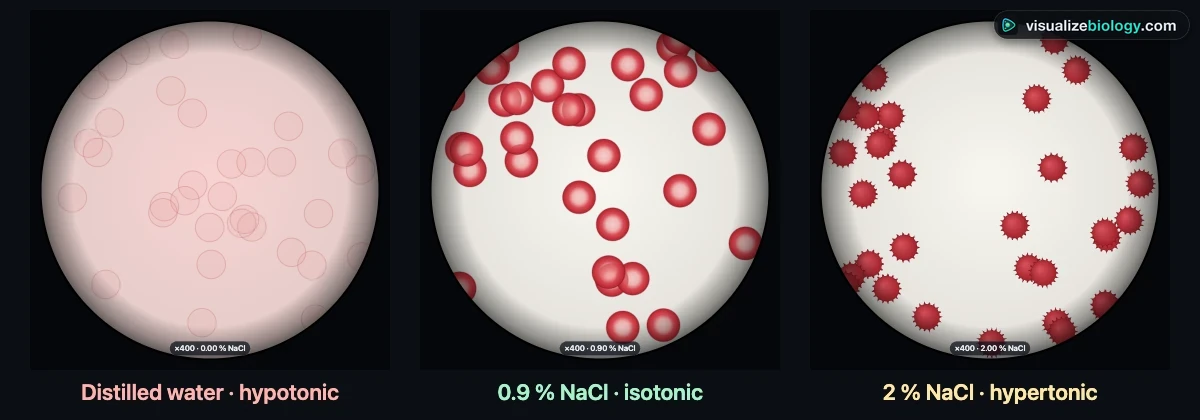
| Hypotonic (more dilute than the cell) | In | Turgid: the vacuole swells and presses the cytoplasm against the cell wall | Swells into a sphere and bursts (haemolysis) |
| Isotonic (same water potential) | No net movement | Flaccid but not plasmolysed | Keeps its biconcave disc shape |
| Hypertonic (more concentrated than the cell) | Out | Plasmolysed: the protoplast pulls away from the wall | Shrinks and crenates (spiky) |
Osmotic pressure and reverse osmosis
Simulate mode strips osmosis down to its essentials: a chamber split by a partially permeable membrane, pure water on side A and salt water on side B. Water crosses the membrane in both directions, but fewer water molecules are free on the salty side, so more cross into it than out of it. Side B fills up and side A empties. Make the membrane leaky enough for salt ions and the salt simply diffuses across instead: the levels hardly move, which shows why osmosis needs a partially permeable membrane.
The pressure that would stop the flow is the osmotic pressure, π = iCRT. Seawater, about 35 g of salt per litre, is 0.60 mol/dm³ of NaCl; with two ions per formula unit, π = 2 × 0.60 × 0.0831 × 293 ≈ 29 bar. The same mass of sugar makes far fewer particles, so its osmotic pressure is about twelve times smaller.
Push on the salt water with a piston and the story changes. Below 29 bar the piston only slows osmosis. Above it, water is forced backwards through the membrane and the salt stays behind: reverse osmosis. As fresh water collects on side A, the brine on side B gets saltier and its osmotic pressure rises, until it equals the applied pressure and the flow stops. That is why desalination plants work at 55 to 70 bar and recover only about 40 to 50 % of the seawater as drinking water.
| Pressure on the salt water | What happens |
|---|---|
| None | Osmosis: water moves from the pure water into the salt water |
| Less than the osmotic pressure | Osmosis continues, more slowly |
| Equal to the osmotic pressure | No net movement of water |
| Greater than the osmotic pressure | Reverse osmosis: water is forced out of the salt water, leaving the salt behind |
The potato osmosis experiment, step by step
- Use a cork borer to cut cores from one potato, then trim them to the same length with a scalpel on a tile. Remove any skin.
- Blot each core dry and record its starting mass on a balance reading to 0.01 g.
- Put one core in each labelled boiling tube of sucrose solution, from distilled water (0 M) to 1.0 M, so each core is fully covered.
- Leave the tubes for the same time, at least 30 minutes or overnight, at the same temperature.
- Remove each core, blot it gently with a paper towel to remove surface liquid, and reweigh it.
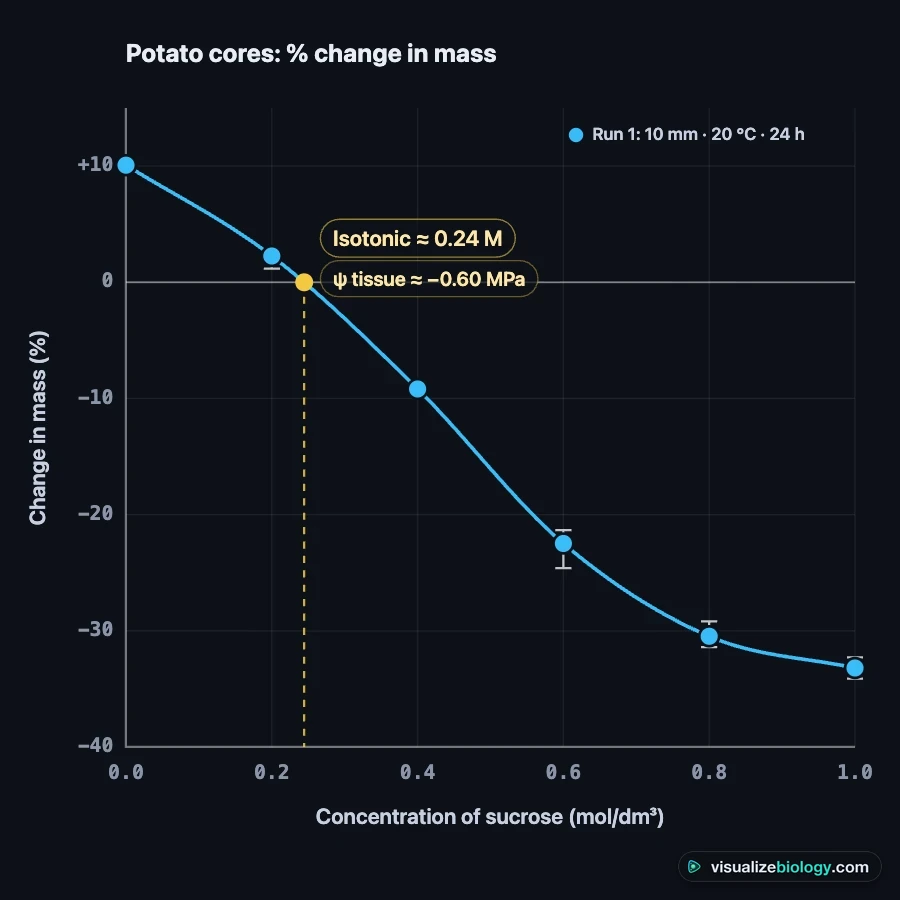
- Calculate the percentage change in mass for each core, then plot it against concentration and read off where the curve crosses zero.
Percentage change in mass = (final mass − initial mass) ÷ initial mass × 100. Using the percentage, not the change in grams, makes cores of different starting masses comparable. The concentration where the curve crosses zero is isotonic with the potato cells: they neither gain nor lose water there.
| Sucrose (mol/dm³) | Water potential of solution | Typical change after 24 h | What happened |
|---|---|---|---|
| 0.0 | 0 MPa | +10 % | Water entered; cells turgid |
| 0.2 | −0.49 MPa | +3 % | A little water entered |
| 0.3 | −0.73 MPa | about 0 % | Close to isotonic |
| 0.4 | −0.97 MPa | −9 % | Water left; cells began to plasmolyse |
| 0.6 | −1.46 MPa | −23 % | Plasmolysed; core soft and bendy |
| 1.0 | −2.44 MPa | −34 % | Plasmolysed; the curve levels off |
Water potential: the A-level calculation
Water potential (ψ, psi) measures how freely water can move, in kilopascals or megapascals. Pure water at atmospheric pressure is 0; any solute makes it negative. In a plant cell ψ = ψs + ψp, where the solute potential ψs is negative and the pressure potential ψp (turgor) is positive. The solute potential of a solution is ψs = −iCRT, with i the number of particles per formula unit (1 for sucrose, 2 for NaCl), C the concentration in mol/dm³, R = 0.00831 dm³ MPa K⁻¹ mol⁻¹ and T the temperature in kelvin.
Worked example: the curve crosses zero at 0.29 M sucrose, at 20 °C. ψ = −1 × 0.29 × 0.00831 × 293 = −0.71 MPa. That is the water potential of the potato tissue. The same tissue would be isotonic with only about 0.14 M NaCl, because each NaCl gives two particles.
The naked egg experiment
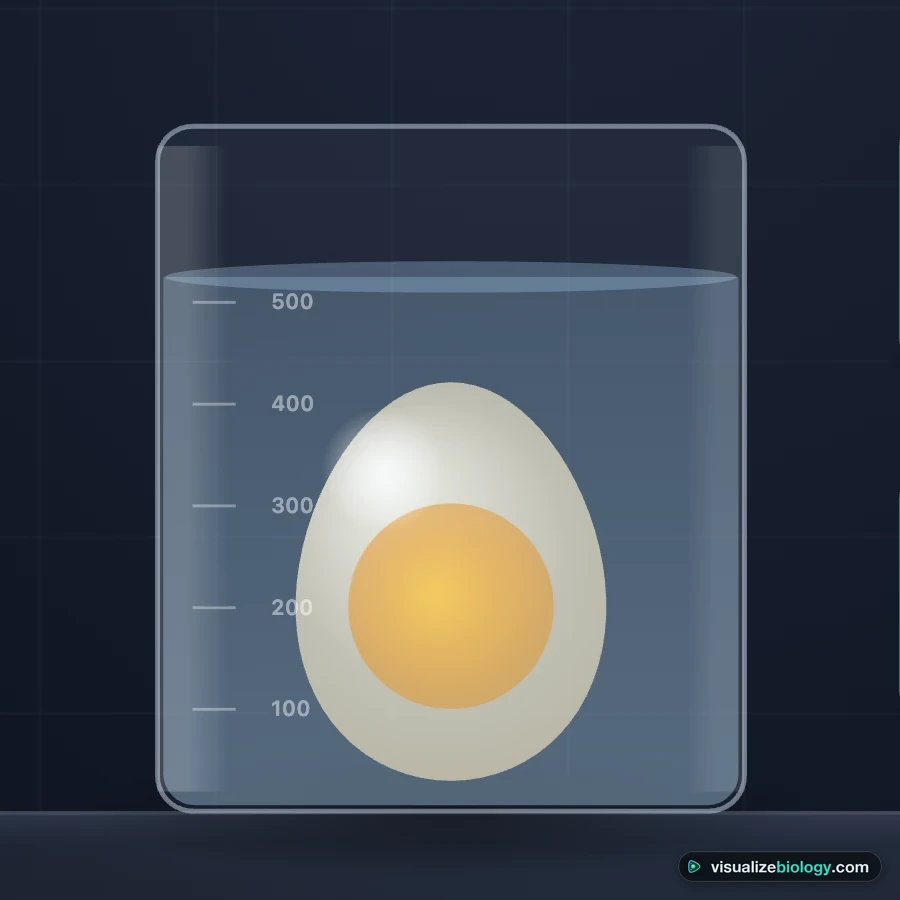
Vinegar (5 % ethanoic acid) reacts with the calcium carbonate shell and releases bubbles of carbon dioxide. After a day or two only the shell membranes are left around the egg: a partially permeable bag of egg white and yolk. In distilled water the egg swells, because the egg white has a lower water potential than the water. In corn syrup, a very concentrated sugar solution, water leaves and the egg shrinks and wrinkles. Weighing it every few hours gives a mass-time graph with a curve that levels off as it approaches equilibrium.
Red blood cells: haemolysis, crenation and osmotic fragility
Animal cells have no cell wall, so water entering by osmosis is not resisted. A red blood cell in a hypotonic solution swells from a biconcave disc into a sphere; its membrane can enclose only so much volume, so it bursts and releases haemoglobin. This is haemolysis. In a hypertonic solution it loses water and crenates. Blood plasma is about 290 mOsm, which is why intravenous drips use 0.9 % sodium chloride: it is isotonic with the cells.
The osmotic fragility test puts blood into a series of saline concentrations, centrifuges the tubes and measures the haemoglobin released with a colorimeter at 540 nm. Healthy cells start to burst at about 0.45 % NaCl, half have burst at about 0.40 % and all have burst by about 0.33 %. Cells that are already spherical, as in hereditary spherocytosis, burst at higher concentrations. Urea, unlike NaCl, crosses the membrane, so even a concentrated urea solution is hypotonic to the cells and they burst. This is the difference between osmolarity and tonicity.
Sources of error and how to reduce them
- Liquid left on the surface adds mass. Blot every core the same way; the lab shows the error if you switch blotting off.
- Cores from different potatoes, or from near the skin, have different water potentials. Use one potato and remove the skin.
- Time and temperature must be the same for every tube. A longer soak gives larger changes.
- Cores that dry out on the bench before weighing lose mass. Weigh them straight away.
- One core per concentration gives no idea of spread. Use three and plot the mean with its range.
Experiments and course links
| Experiment | What you find out | Course links |
|---|---|---|
| Potato cores in sucrose | How concentration affects the change in mass; the isotonic point | AQA GCSE Biology RP3, Edexcel GCSE CP1.16, Cambridge IGCSE 3.2 |
| Water potential of potato tissue | ψ of the tissue from the calibration curve and ψs = −iCRT | AQA A-level Biology RP3, IB Biology D2.3, NCERT Class 11 |
| Surface area and rate | How core size affects the rate of osmosis | GCSE, AP Biology |
| Temperature and rate | Faster osmosis when warm; membranes damaged above about 45 °C | GCSE, A-level |
| The naked egg | Osmosis through a single membrane; mass against time | Middle school, GCSE, AP Biology Lab 4 |
| Red blood cells under the microscope | Haemolysis and crenation; why a drip is 0.9 % saline | GCSE, A-level, AP Biology 2.8 |
| Osmotic fragility test | The NaCl concentration that bursts half the cells; tonicity versus osmolarity | A-level, college physiology |
Who uses this osmosis lab?
Students use it to rehearse the required practical, to catch up on a missed lesson, and to practise percentage change and water potential questions with worked answers. Teachers put it on a projector to show what happens inside the cells while the tubes sit on the bench, and set the experiments as homework when there is no time for a 24-hour soak. It needs no login, so it works on school Chromebooks, and the share bar has a QR code for the classroom.
Frequently asked questions
What is reverse osmosis?
Reverse osmosis forces water the opposite way to osmosis. A pressure greater than the solution's osmotic pressure is applied to the salty side, so water molecules are pushed through a partially permeable membrane and the salt is left behind. Seawater has an osmotic pressure of about 29 bar, so desalination plants use 55 to 70 bar.
What is osmotic pressure?
Osmotic pressure is the pressure that must be applied to a solution to stop pure water moving into it across a partially permeable membrane. For a dilute solution π = iCRT, so it depends on the number of dissolved particles: 35 g/L of salt has about twelve times the osmotic pressure of 35 g/L of sugar.
What is osmosis?
Osmosis is the net movement of water molecules from a region of higher water potential (a dilute solution) to a region of lower water potential (a more concentrated solution) through a partially permeable membrane. It is passive: it needs no energy from the cell.
Why does a potato core gain mass in water and lose mass in strong sugar solution?
Potato cells have a water potential of about −0.7 MPa. Pure water (0 MPa) has a higher water potential, so water enters the cells by osmosis and the core gains mass. A 1 M sucrose solution (about −2.4 MPa) has a lower water potential, so water leaves the cells and the core loses mass.
How do you find the concentration at which a potato neither gains nor loses mass?
Plot percentage change in mass against concentration, draw a curve of best fit and read the concentration where it crosses zero. For potato this is usually about 0.25 to 0.35 M sucrose. At that concentration the solution is isotonic with the cells.
Why do you calculate percentage change in mass rather than change in mass?
The cores do not all start at exactly the same mass. Percentage change, (final − initial) ÷ initial × 100, lets you compare cores of different starting masses fairly.
What happens to red blood cells in hypotonic, isotonic and hypertonic solutions?
In a hypotonic solution such as distilled water, water enters, the cells swell into spheres and burst (haemolysis), because animal cells have no cell wall. In isotonic 0.9 % saline they keep their biconcave shape. In a hypertonic solution such as 2 % saline, water leaves and they shrink and crenate.
Why does an egg get bigger in water after its shell is dissolved in vinegar?
Vinegar dissolves the calcium carbonate shell and leaves the egg inside its partially permeable membranes. The egg white has a lower water potential than distilled water, so water moves in by osmosis and the egg swells. In corn syrup the water moves out and the egg shrinks.
What is the difference between plasmolysis and haemolysis?
Plasmolysis happens to plant cells in a concentrated solution: the cytoplasm and vacuole shrink and the membrane pulls away from the cell wall. Haemolysis happens to red blood cells in a dilute solution: they swell and burst. Plant cells do not burst in water because the cell wall resists the expansion.
Can I use this for the GCSE osmosis required practical?
Yes, as preparation and revision. The potato experiment follows AQA Required Practical 3 and Edexcel Core Practical 1.16, including percentage change in mass and the graph. The A-level experiment adds the water potential calculation. It does not replace hands-on lab work.
Explore related simulators
See what osmosis does to a whole animal cell and plant cell, and how the sodium-potassium pump stops a cell swelling, in the Virtual Living Cell. See osmosis inside living plant cells with the Virtual Microscope: its Elodea slide plasmolyses in salt solution and recovers in water. See where the blood those red cells travel in goes in the heart simulator, which follows blood through the heart step by step. Watch a cell divide stage by stage in the Mitosis Simulator. See how a freshwater protist survives osmosis in the Virtual Amoeba Simulator: its contractile vacuole pumps out the water that keeps entering. Coming next to VisualizeBiology: diffusion and surface area and the enzyme activity lab. For engineering and physical-science simulators, see our sister site MechSimulator. See osmosis at work in a whole plant, as root hairs take in water that then climbs the xylem to the leaves, in the Xylem and Phloem simulator. Watch the colon absorb water from food waste in the Human Digestive System Simulator. See osmosis at work in the body as the kidney’s collecting ducts draw water out of urine under ADH in the Kidney Simulator.
Sources: OpenStax Biology 2e, §5.2 Passive Transport; Taiz, Zeiger, Møller & Murphy, Plant Physiology and Development (6th ed., 2015), chapter 3; Nobel, Physicochemical and Environmental Plant Physiology (5th ed., 2020); Parpart et al., "The osmotic resistance (fragility) of human red cells", J. Clin. Invest. 26 (1947); AQA GCSE Biology (8461) and A-level Biology (7402) required practical handbooks. This is an educational model, not medical advice.
Updated