
Photosynthesis Lab
A free virtual lab in 3D: light a living plant, starve it of carbon dioxide, warm it up, then look inside a chloroplast to see what limits the rate. Count pondweed bubbles and float leaf discs as in the real practicals.
Live maths
Lab notebook
Every bubble count, floating-disc count, sensor reading and starch test is recorded here with the conditions it was made in. Export a CSV, or turn the whole session into a PDF lab report.
| # | Specimen | Time | Conditions | Measured | Value |
|---|
Concept library
Click "New problem" to begin.
Click "Start quiz" for 5 questions: calculations, limiting factors, light and practical skills.
1 Overview
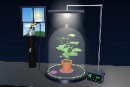
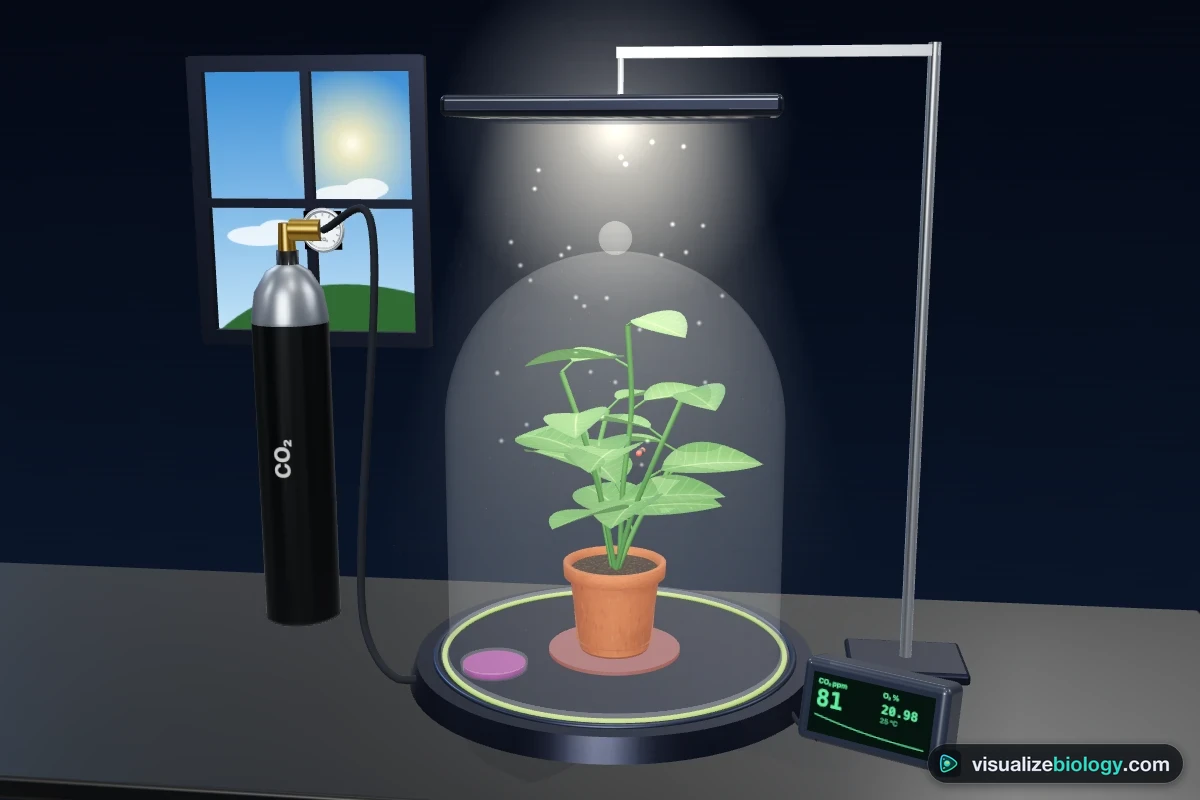
Simulate is the fundamentals: a plant in a glass dome under a grow lamp. You control the three limiting factors — light (brightness and colour), carbon dioxide and temperature — and see the result three ways: on the bench (sensors, an indicator dish, the plant itself), inside a leaf, and inside a chloroplast. Experiment applies it to the two classic school practicals: pondweed giving off bubbles of oxygen under a lamp on a metre rule, and leaf discs that float as oxygen collects in their air spaces. Every number comes from one leaf model checked against textbook values.
It has three modes: Simulate (a free lab with learning aids and a concept library), Experiment (six practicals you carry out by hand and write up as a PDF lab report) and Quiz (a practice quiz with worked solutions, then a 5-question quiz with a star rating). The Units switch shows lamp distances and temperatures in SI (cm, °C) or US units (in, °F). Light (µmol m⁻² s⁻¹), carbon dioxide (ppm, % NaHCO₃) and gas volumes are the same in both.
2 Getting started
- The bench opens in 3D on a computer or tablet and in 2D on a phone. The 2D | 3D switch changes it any time and remembers your choice.
- Simulate opens on the plant in the dome with the lamp on. Turn the Brightness down and watch the rate fall; open Status (or press S) to see which factor is limiting.
- Press 🔒 Seal the dome and start the lab clock (▶ in the command bar, the Time panel, or the Space key). The plant uses up its carbon dioxide and the indicator dish turns purple. Turn the lamp off and it turns yellow again as the plant respires.
- Switch the view on the right between Leaf, Chloroplast and Graph.
- For the practicals, open Experiment and choose one.
3 The plant in a dome (Simulate)
- Light: switch the grow lamp on or off (day and night), set its brightness from 0 to 2000 µmol m⁻² s⁻¹ (full sunlight is about 2000), and its colour. Coloured LEDs give the same number of photons as white, so only the colour changes: a fair test.
- CO₂ & heat: the carbon dioxide concentration (0 to 2000 ppm; air is about 420) and the temperature (0 to 50 °C). Seal the dome and the plant changes its own air: in light it uses up carbon dioxide until photosynthesis stops at the CO₂ compensation point; in the dark it breathes it out.
- The data logger on the base shows CO₂, O₂ and the temperature. The indicator dish holds hydrogencarbonate indicator: purple when CO₂ is low, red in normal air, yellow when CO₂ is high.
- 🧪 Starch test: a leaf is boiled, decolourised in ethanol and covered in iodine. Blue-black means it has made starch.
4 Leaf, chloroplast and graph views
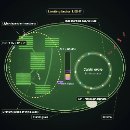
- Leaf: a cross-section of the leaf (palisade cells packed with chloroplasts, air spaces, a vein and stomata) with light arriving, carbon dioxide diffusing in and oxygen and water vapour leaving. For pondweed it shows the leaf's living cells under the microscope, with chloroplasts streaming round each cell. For leaf discs it shows the air spaces filling with oxygen.
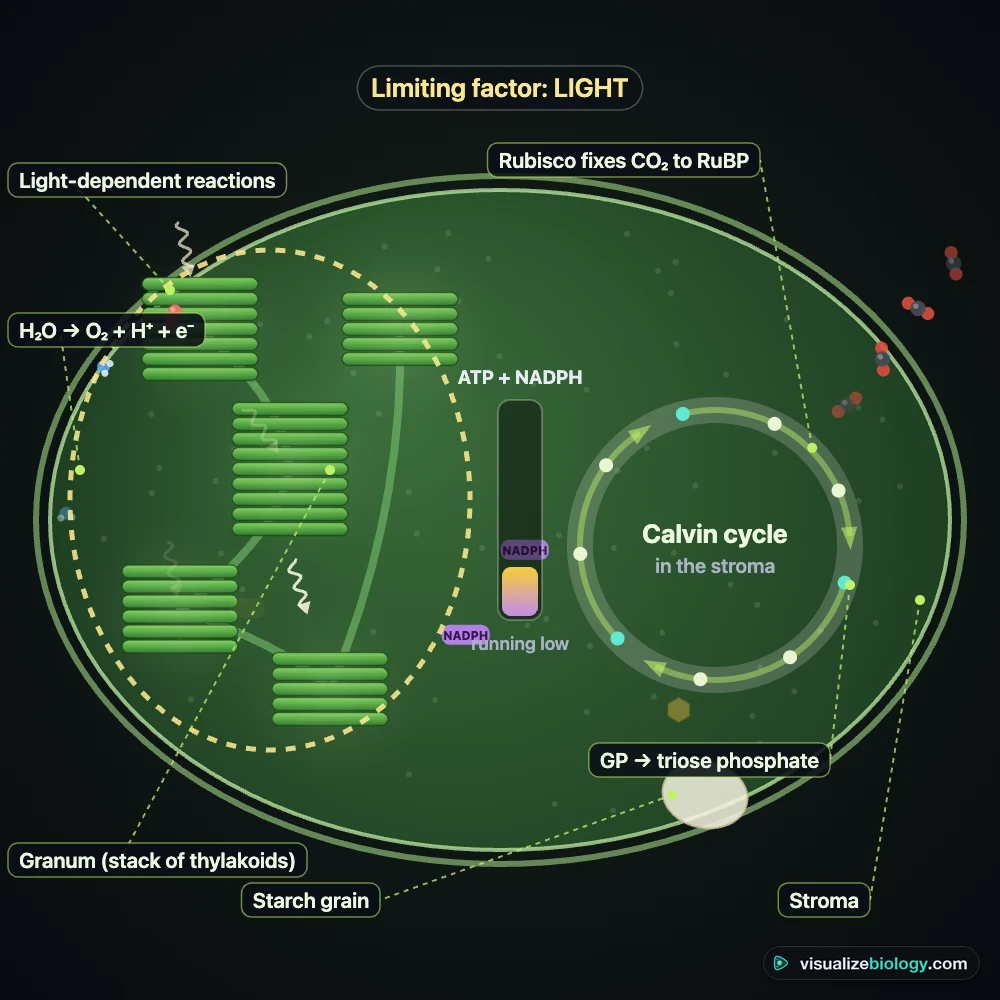
- Chloroplast: the light-dependent reactions on the thylakoids (light splits water, oxygen leaves, ATP and NADPH are made) and the Calvin cycle in the stroma (carbon dioxide is fixed into sugar). Whatever is limiting the rate is highlighted: too little light starves the thylakoids, too little carbon dioxide stalls the Calvin cycle, and cold slows its enzymes. The chips under the view switch between the GCSE picture and the A-level picture with every stage named.
- Graph: in Simulate, the rate against light, CO₂, temperature or colour (with the action and absorption spectra), or the gases over time. In the practicals, your own results. Model curve draws what the model predicts.
- Status (top-right of the view, or key S): light at the leaf, CO₂, temperature, the gross rate of photosynthesis, the net rate of oxygen release and the limiting factor.
5 Pondweed
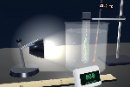
A sprig of Elodea in a boiling tube of sodium hydrogencarbonate solution stands in a beaker of water. Drag the lamp along the metre rule (or use the Lamp distance slider) and watch the stream of bubbles from the cut stem. Press ⏱ Count bubbles to count for one minute of lab time; each count goes into the notebook with the distance, colour, NaHCO₃ and water temperature. A filament bulb warms the water when it is close; a heat shield (a tank of water) stops most of that. Room lights add background light, which matters when the lamp is far away. Press ↺ New run to start a second set of results on the same graph.
6 Leaf discs
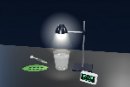
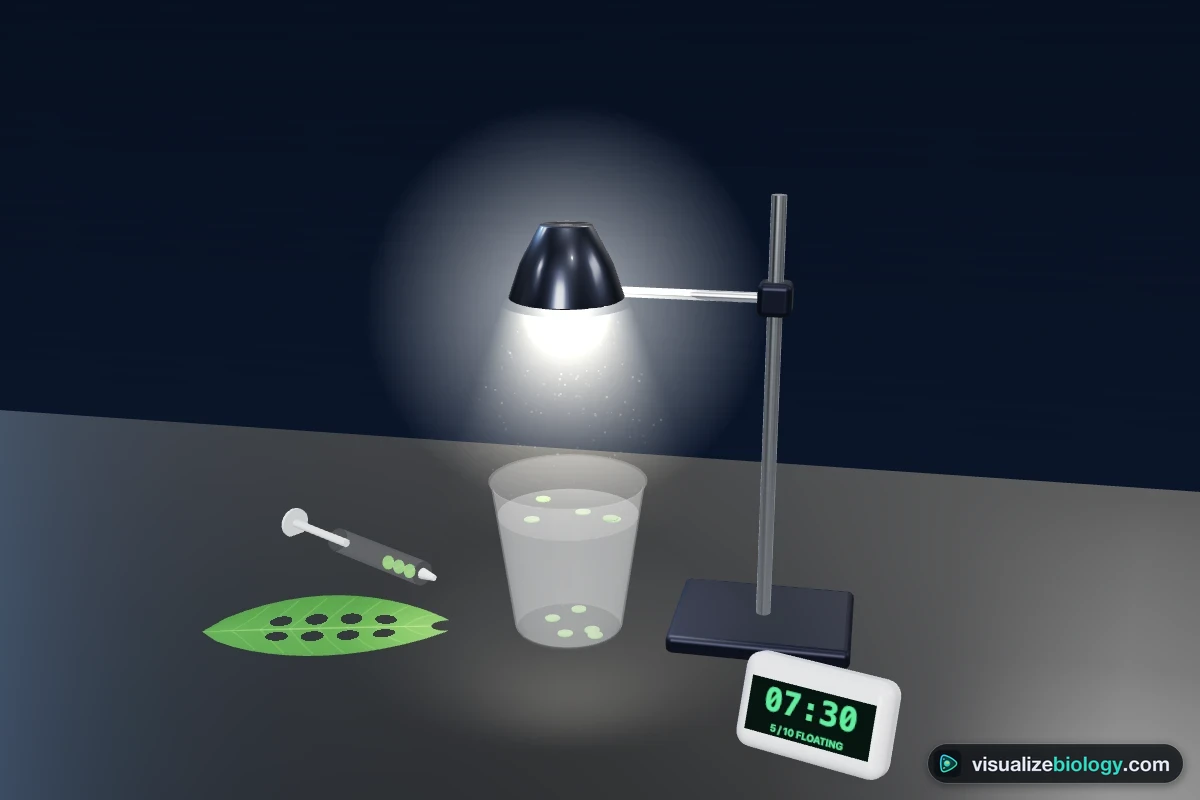
Ten discs are punched from a spinach leaf and the air is drawn out of them with a syringe, so they sink in the sodium hydrogencarbonate solution. Press ⬇ Drop the discs in and run the clock: as photosynthesis fills their air spaces with oxygen, they float one by one. Record every minute logs how many are floating; the graph shows the count against time and the time for half of them to float (ET50). A faster rate of photosynthesis gives a shorter ET50.
7 Experiment mode and the lab report
Pick one of six experiments: light intensity and the rate of photosynthesis (GCSE), light and carbon dioxide as limiting factors (A-level), the concentration of hydrogencarbonate, temperature, the colour of light, and the floating leaf disc assay (AP Biology Lab 5). Each shows its aim, what you need and a real-lab safety note. The method ticks off as you do each step, a timer runs, and your results go into the lab notebook. Answer the conclusion question from your own results, then press Create lab report for a PDF with your results table, graph, calculations and sources of error. The chloroplast view and the model curve are switched off in Experiment mode.
8 Quiz
The Quiz tab opens on the practice quiz: the inverse square law, rates from bubble counts and ET50, reading limiting factors from graphs, the compensation point, the indicator colours, the action spectrum and practical errors. Pick a topic, answer, press Check, and Show solution for a worked answer. Then choose Take the quiz: 5 mixed questions and a 0–3 star rating.
9 Keyboard and gestures
- Space starts or pauses the clock, S opens Status, L, C and G switch the view to Leaf, Chloroplast or Graph, and the ← / → arrow keys move the lamp.
- Scrolling over the 3D bench always scrolls the page. To zoom the bench, hold Ctrl (⌘ on a Mac) and scroll, pinch the trackpad, or click the bench first. Drag the lamp itself to move it; drag anywhere else to look around.
- On a phone, switch Bench / Observe at the top of the lab, or tap the small picture to swap. The controls live in the deck at the bottom of the screen: Light, CO₂ & heat, Time and Measure.
Photosynthesis simulator: limiting factors, the pondweed practical and leaf discs
This photosynthesis lab is a free, browser-based simulation of how fast a plant photosynthesises and what controls it. In Simulate you light a living plant under a glass dome, change its carbon dioxide and temperature, and look inside a leaf and a chloroplast to see what is happening. In Experiment you carry out the two practicals every biology course uses: counting the bubbles of oxygen from pondweed under a lamp, and timing leaf discs as they float. Every rate comes from one model of a leaf, so the results behave like real ones: they rise with light, level off when something else limits them, fall in the cold and collapse when the plant overheats.
- Specimens
- A potted plant in a glass dome, Elodea pondweed and spinach leaf discs
- Variables
- Light intensity (0 to 2000 µmol m⁻² s⁻¹, or lamp distance 5 to 100 cm), colour of light, CO₂ (0 to 2000 ppm or 0 to 2 % NaHCO₃), temperature (0 to 50 °C)
- Measurements
- Bubbles per minute, floating discs and ET50, CO₂ and O₂ sensors, indicator colour, starch test
- Views
- 3D or 2D bench, leaf cross-section, the inside of a chloroplast, live graphs
- Model
- Non-rectangular hyperbola for light, Michaelis–Menten for CO₂, an enzyme curve for temperature, respiration with Q₁₀ = 2
- Modes
- Simulate, Experiment (6 practicals) and Quiz
- Runs on
- Any modern browser, including Chromebooks, tablets and phones. 3D on larger screens, 2D on phones.
- Price
- Free, with no account or download
What is photosynthesis?
Photosynthesis is the process in which green plants and algae use light energy to make glucose from carbon dioxide and water, giving off oxygen. It takes place in chloroplasts, mostly in the palisade cells of the leaf, where chlorophyll absorbs the light. It is endothermic: energy from light is transferred to the chemical bonds of glucose, which the plant uses for respiration, stores as starch, or turns into cellulose, proteins and oils.
carbon dioxide + water → glucose + oxygen · 6CO₂ + 6H₂O → C₆H₁₂O₆ + 6O₂
It happens in two linked stages. In the light-dependent reactions on the thylakoid membranes, light splits water: oxygen is released and the energy is stored in ATP and NADPH. In the Calvin cycle in the stroma, the enzyme rubisco fixes carbon dioxide, and ATP and NADPH turn it into sugar. The chloroplast view in the lab shows both stages running at the rate the model predicts.
Limiting factors: light, carbon dioxide and temperature
The rate of photosynthesis is set by whichever factor is in shortest supply — the limiting factor, an idea first set out by F. F. Blackman in 1905. In dim light, doubling the light roughly doubles the rate, because the light-dependent reactions cannot keep up. In bright light the rate levels off: now the Calvin cycle is the bottleneck, and only more carbon dioxide or a warmer temperature (up to the enzymes' optimum, about 29 °C here) will raise it further. Above about 35 °C the enzymes begin to denature and by 40 °C the rate has collapsed.
| Factor | Why it limits | What the graph does |
|---|---|---|
| Light intensity | Too little energy for the light-dependent reactions, so too little ATP and NADPH | Rises steeply, then levels off |
| Carbon dioxide | Too little substrate for rubisco in the Calvin cycle | Rises, then levels off at a higher plateau if light is bright |
| Temperature | Enzyme-controlled reactions are slow in the cold and denature in the heat | Rises to an optimum, then falls sharply |
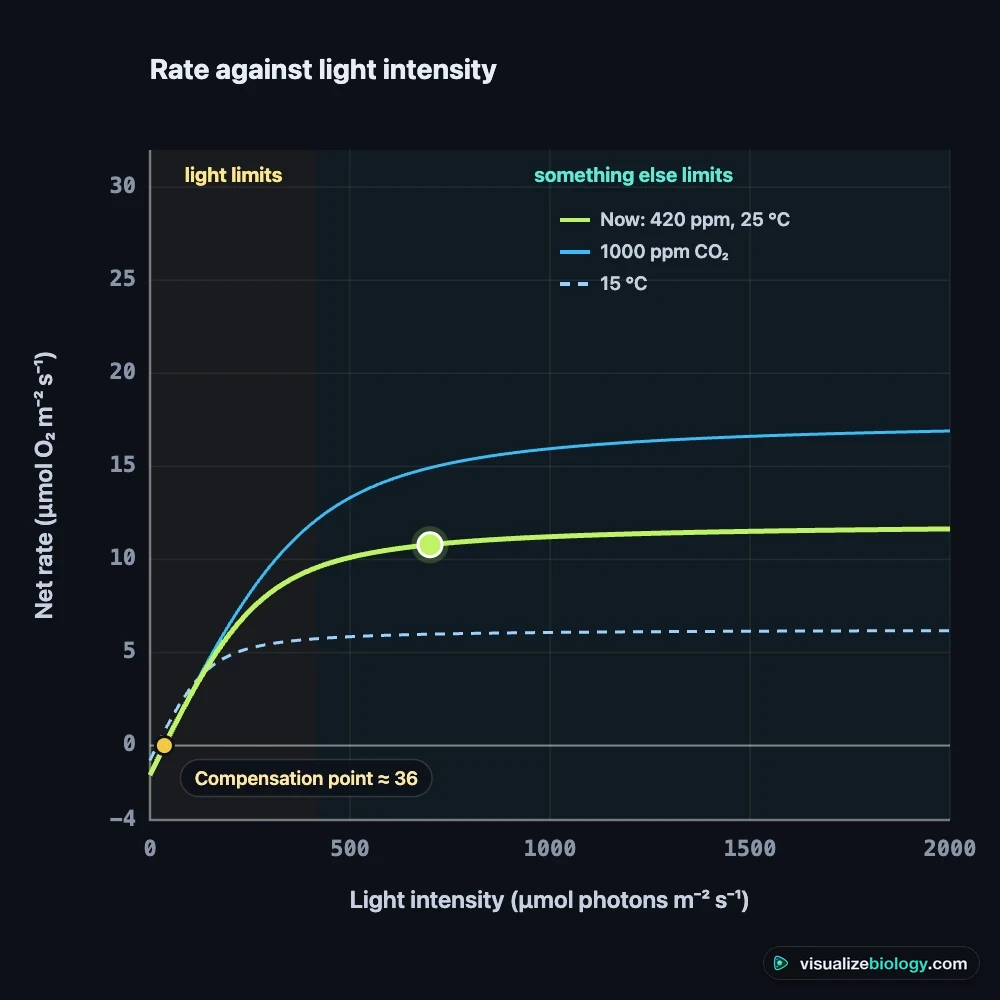
Growers use this. Commercial greenhouses add carbon dioxide (often to about 1000 ppm), light and heat, but only while each one still raises the yield enough to pay for itself. Turning up a factor that is not limiting costs money and does nothing.
The pondweed experiment, step by step
- Cut the end of a pondweed sprig and put it upside down in a boiling tube of 1 % sodium hydrogencarbonate solution, which supplies carbon dioxide, standing in a beaker of water at room temperature.
- Put an LED lamp 10 cm from the pondweed, measured with a metre rule. Switch off other lights.
- Leave the pondweed for 5 minutes so it adjusts to the new light intensity.
- Count the bubbles given off from the cut stem in one minute. Repeat twice and calculate the mean.
- Repeat with the lamp at 20, 30, 40 and 50 cm.
- Plot the number of bubbles per minute against distance, or against light intensity calculated as 1/d².
Light intensity falls with the square of the distance (the inverse square law), so moving the lamp from 10 cm to 20 cm leaves only a quarter of the light. In the lab's results at 25 °C the bubbling falls from about 46 a minute at 10 cm to about 4 at 40 cm. Plotted against 1/d² the points lie on a straight line at first and then level off when the lamp is close, because light is no longer the limiting factor.
| Distance (cm) | Light, 1/d² (m⁻²) | Bubbles per minute | Limiting factor |
|---|---|---|---|
| 10 | 100 | 46 | Temperature (light nearly saturating) |
| 20 | 25 | 25 | Light |
| 30 | 11 | 10 | Light |
| 40 | 6.3 | 4 | Light |
| 50 | 4.0 | 1 | Light |
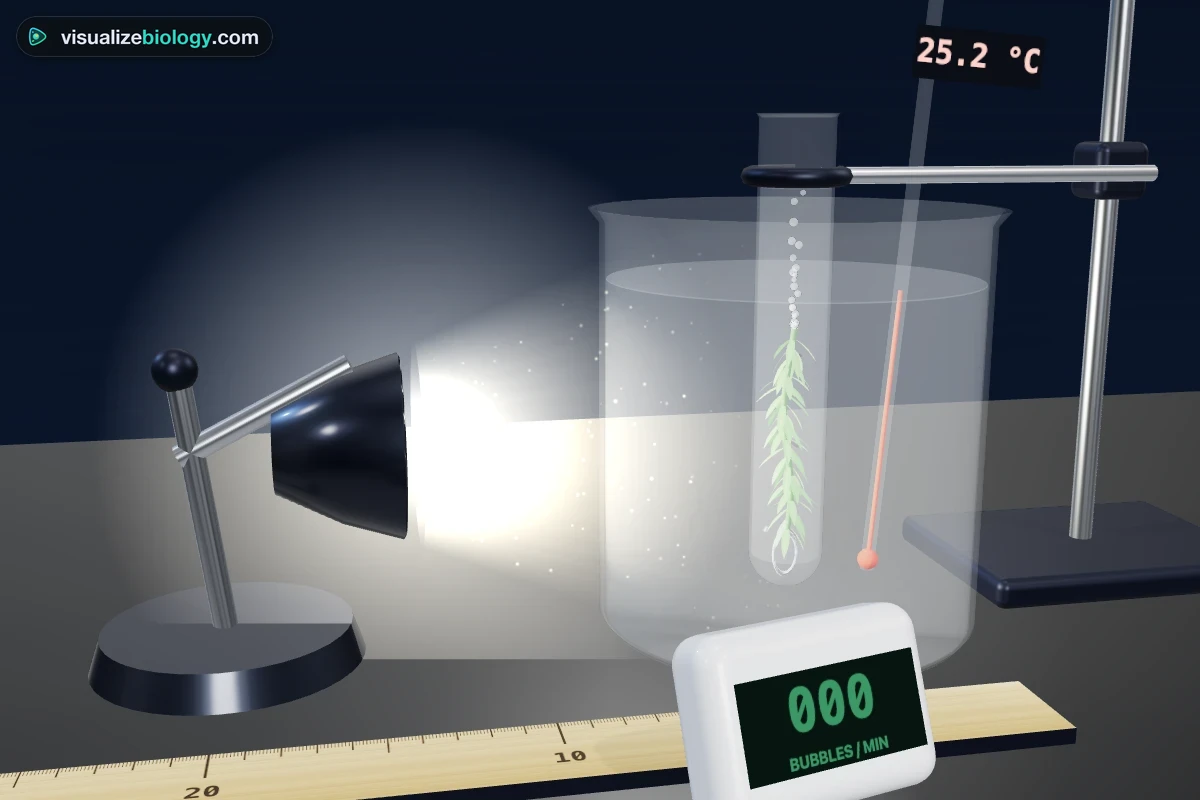
Sources of error. Bubbles are not all the same size, so counting them is less accurate than collecting the gas in a gas syringe or measuring a bubble in the capillary tube of a photosynthometer. The gas is not pure oxygen. A filament bulb heats the water when it is close, which adds a second variable: use an LED, or a heat shield of water, and check the temperature. Light from windows and ceiling lights matters most when the lamp is far away. The pondweed needs a few minutes to adjust after each change.
The floating leaf disc assay
In AP Biology Lab 5, discs are punched from a spinach leaf and the air is drawn out of them with a syringe, so their air spaces fill with a weak solution of sodium hydrogencarbonate and they sink. Under a lamp, oxygen from photosynthesis collects in the air spaces and the discs float one by one. The time for half of them to float, the ET50, is shorter when photosynthesis is faster, so 1/ET50 is a measure of the rate. Without hydrogencarbonate, or in the dark, the discs stay on the bottom.
Light colour, the action spectrum and the compensation point
Chlorophyll absorbs blue and red light strongly and reflects much of the green, which is why leaves look green. The action spectrum (the rate of photosynthesis at each wavelength) follows the absorption spectrum of the pigments closely, with peaks in the blue and red. With coloured filters, pondweed gives off the most bubbles in white and red light and the fewest in green. Green light is not useless, though: inside a thick land leaf, scattered green light is still caught, and it drives about two-thirds as much photosynthesis as red.
Plants respire all the time. At the compensation point, the light intensity where photosynthesis just balances respiration, there is no net exchange of gases. In the dome, hydrogencarbonate indicator shows it: yellow in the dark (carbon dioxide is given out), red at the compensation point, purple in bright light (carbon dioxide is taken in).
| Hydrogencarbonate indicator | Carbon dioxide | What the plant is doing |
|---|---|---|
| Yellow | Higher than air | Respiring more than photosynthesising (dark or dim light) |
| Red / orange | Same as air | At the compensation point, or no plant |
| Purple | Lower than air | Photosynthesising faster than respiring |
Experiments and course links
| Experiment | What you find out | Course links |
|---|---|---|
| Light intensity and rate | How lamp distance affects bubbles per minute; the inverse square law | AQA GCSE Biology RP6, Edexcel GCSE CP5.18, Cambridge IGCSE 6.1 |
| Light and CO₂ as limiting factors | Two curves that level off at different heights | AQA A-level 3.5.1, IB Biology C1.3, NCERT Class 11 |
| Hydrogencarbonate concentration | Rate against carbon dioxide supply | GCSE, IGCSE, A-level |
| Temperature | An optimum near 29 °C and denaturation above about 35 °C | GCSE, A-level |
| Colour of light | Red and blue drive photosynthesis more than green | GCSE, IB, AP Biology |
| Floating leaf discs | ET50 and 1/ET50 as a rate | AP Biology Lab 5, NGSS HS-LS1-5 |
Who uses this photosynthesis lab?
Students use it to rehearse the required practical, to see the limiting-factor graphs build themselves, and to practise inverse square law, rate and graph questions with worked answers. Teachers put it on a projector to show what happens inside the chloroplast while the bubbles rise, and set the experiments as homework when pondweed is out of season or the lab is booked. It needs no login, so it works on school Chromebooks, and the share bar has a QR code for the classroom.
Frequently asked questions
What are the limiting factors of photosynthesis?
Light intensity, carbon dioxide concentration and temperature. A limiting factor is the one in shortest supply: increasing it increases the rate, while increasing the others does not. In dim light the rate rises in proportion to light; in bright light it levels off because carbon dioxide or temperature now limits the Calvin cycle.
How do you measure the rate of photosynthesis with pondweed?
Put a cut sprig of Elodea or Cabomba upside down in a boiling tube of sodium hydrogencarbonate solution, place a lamp a measured distance away, leave it a few minutes to adjust, then count the bubbles of oxygen from the cut stem for one minute. Repeat at several distances. Collecting the gas in a gas syringe or a photosynthometer is more accurate than counting bubbles.
Why does light intensity follow the inverse square law?
Light from a small lamp spreads out over the surface of a growing sphere, so its intensity is proportional to 1/d². Doubling the distance from the lamp gives a quarter of the light. Plotting rate against 1/d² therefore gives a straight line while light is the limiting factor.
What is the compensation point?
The light intensity at which the rate of photosynthesis equals the rate of respiration, so there is no net exchange of oxygen or carbon dioxide. Below it the plant gives out carbon dioxide; above it the plant takes it in. For a typical leaf it is about 1 to 3 % of full sunlight.
Why do leaf discs float in the leaf disc experiment?
The air is first drawn out of the discs with a syringe so their air spaces fill with sodium hydrogencarbonate solution and they sink. In the light, photosynthesis makes oxygen faster than respiration uses it; the oxygen collects in the air spaces and the discs float. The faster the photosynthesis, the sooner half of them float (ET50).
Explore related simulators
Follow the glucose a palisade cell makes into its mitochondria, and see its chloroplasts move with the light, in the Virtual Living Cell. See living Elodea cells and their chloroplasts with the Virtual Microscope, and how water moves into those cells by osmosis in the Osmosis Lab. The heart simulator follows the oxygen we breathe in round the body. See how the root tips that plants grow divide in the Mitosis Simulator. Follow the energy that plants fix up through herbivores and predators in Build the Food Chain, a drag-and-drop food chain and food web builder. Coming next to VisualizeBiology: cellular respiration and the enzyme activity lab. For engineering and physical-science simulators, see our sister site MechSimulator. Follow the sugar a leaf makes down the phloem to the roots, and the water it needs up the xylem, in the Xylem and Phloem simulator. A leaf short of nitrogen cannot make enough chlorophyll or Rubisco: see how plants get their nitrogen in the Nitrogen Cycle Simulator. The sugar a plant makes also pays for its flowers: watch a hibiscus being pollinated and making seeds in the Pollination Simulator.
Sources: OpenStax Biology 2e, chapter 8 Photosynthesis; Blackman, "Optima and limiting factors", Annals of Botany 19 (1905); McCree, "The action spectrum, absorptance and quantum yield of photosynthesis in crop plants", Agricultural Meteorology 9 (1972); Taiz, Zeiger, Møller & Murphy, Plant Physiology and Development (6th ed., 2015), chapters 7 to 9; Thornley, Mathematical Models in Plant Physiology (1976); AQA GCSE Biology (8461) required practical handbook; College Board, AP Biology Investigative Labs, Lab 5. This is an educational model.
Updated