
Build the Food Chain
Drag organisms onto the board and draw arrows from each food to whatever eats it. Watch sunlight become energy that flows up your food chain, see the pyramids grow, then run the ecosystem and find out what happens when a species disappears.
Live math
Lab notebook
Every measurement you record, and every big event in your ecosystem (a species dying out, a population explosion, a drought), is written here with its conditions. Export a CSV, or turn the session into a PDF lab report.
| # | Lab / organism | Conditions | Measurement | Result |
|---|
Concept library
Click "New problem" to begin.
Click "Start quiz" for 5 questions on food chains, food webs, trophic levels, energy flow and pyramids.
1 Overview
Simulate opens with a short guided tour that builds a food chain in front of you, one organism at a time. Then it is your turn: pick a habitat, drag organisms onto the board and draw arrows from each food to whatever eats it. The simulator works out the trophic levels, counts the food chains, shows the energy flowing and builds the pyramids. Press ▶ Run to see the populations change over the years, then change the ecosystem in What if?. Experiment has seven labs that end in a PDF lab report, and Quiz has a practice quiz with worked solutions and a 5-question quiz.
2 Building a food chain or web
- Choose a Habitat in the top bar: meadow, ocean, pond, forest (Yellowstone), savanna, Arctic or desert. Each has its own organisms and its own board.
- Drag an organism from the tray at the bottom of the board onto the habitat, or tap it to drop it in a free spot. The tray filters by role: producers, herbivores, omnivores, carnivores and decomposers.
- To draw an arrow, drag from the small dot on the food to the organism that eats it. With the ➜ Arrow tool you can drag from anywhere on the food, or tap the food and then the eater. Arrows always point from food to eater: the way energy flows.
- With Live check on, a wrong arrow is explained straight away (and a backwards arrow can be flipped). 🧽 Erase removes an organism or an arrow; so does selecting it and pressing Delete.
- Drag organisms to tidy the board yourself, or use 📐 Tidy by level to put them in rows by trophic level.
3 What the board shows
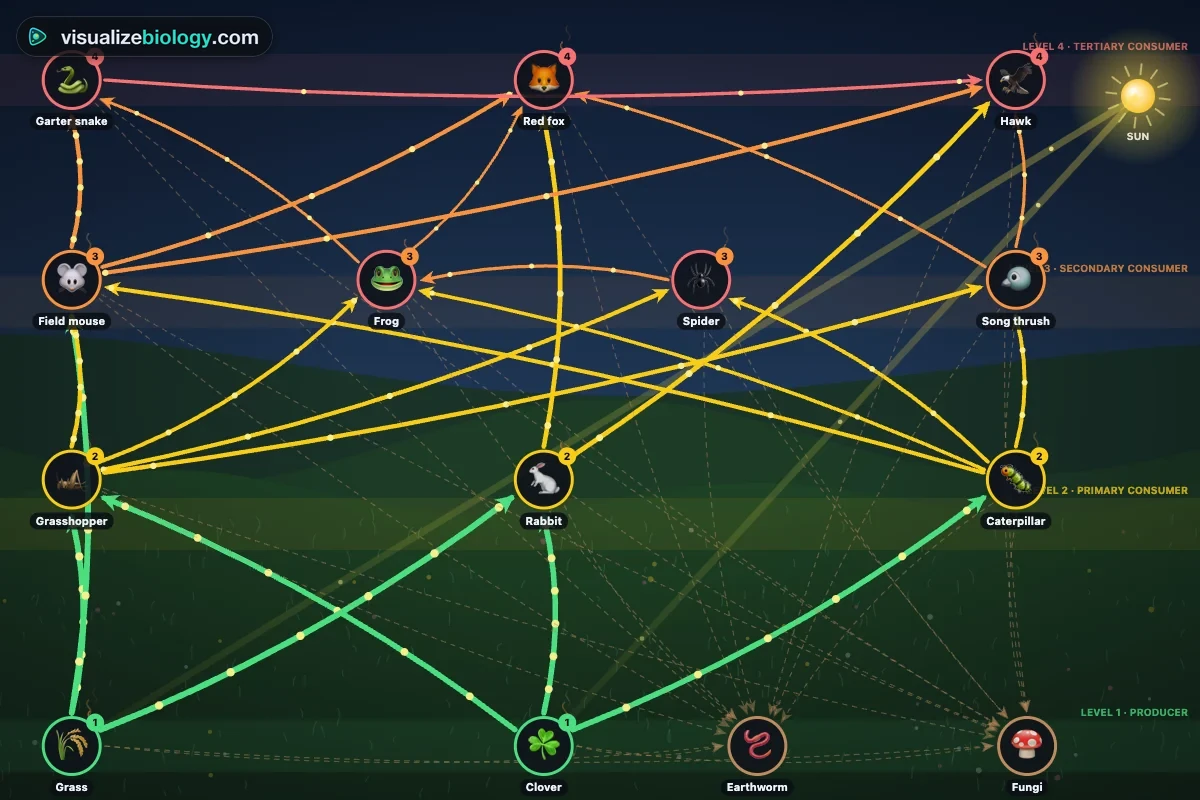
- The colored ring round each organism is its role: green producer, yellow herbivore, orange omnivore, red carnivore, brown decomposer. With Levels on, the badge gives its trophic level; an omnivore that eats at two levels gets an in-between number, such as 2.5.
- With Energy on, sunlight beams onto the producers, gold pulses run along the arrows (thicker where more energy flows) and orange wisps rise from each organism: the heat lost in respiration.
- An organism with a dashed ring has no food on the board. While the ecosystem runs, organisms grow or shrink with their population, and a grey one with a cross has died out.
- Select an organism to see what it eats, what eats it, its trophic level, numbers and energy in the Organism panel.
4 Pyramid, Energy, Graph and DDT
- Pyramid: numbers, biomass or energy at each trophic level, on a log or a true scale. Try an oak tree with caterpillars to see an inverted pyramid of numbers, or the ocean for an inverted pyramid of biomass.
- Energy: sunlight, the energy each level takes in, the percentage passed on, and what is lost as heat or goes to decomposers. Change the transfer efficiency in the Energy panel.
- Graph: every population over time, compared with its normal number. Select an organism to pick out its line.
- DDT: turn on Spray DDT and run the ecosystem: the pesticide builds up at each level.
5 Running the ecosystem and What if?
▶ Run (or Space) steps the populations forward in years. The model is a Lotka–Volterra model of exactly the web you built, calibrated so that each species is at its normal number in its full habitat: predators switch to the prey they have, a consumer with no food starves, and a producer with nothing eating it grows until it runs out of room. In What if? cause a drought, spread a disease, wipe out or reintroduce the selected organism, or spray DDT. Without decomposers, dead matter piles up and producers slowly run short of nutrients.
6 Experiment mode and the lab report
Seven labs: build a four-level food chain and label it, turn field notes into a food web, measure the energy at each level and calculate the transfer efficiency, survey a woodland for pyramids of numbers and biomass, remove and bring back the wolves of Yellowstone, follow the hare and lynx cycle, and sample DDT in a pond. Each shows its aim, what you need and a real-lab safety note; the method ticks off as you work, a conclusion question checks your result, and Create lab report builds a PDF with your web, results, graph and calculations.
7 Quiz
The practice quiz asks about roles, trophic levels, food chains read from a picture, food webs and what happens when a species is removed, the 10 % rule with calculations, pyramids and biomagnification, each with a worked solution. Take the quiz gives five mixed questions and a star rating. Energies follow the kJ | kcal switch.
8 Keyboard and gestures
- Space runs or pauses the ecosystem, B picks Build, A the arrow tool, E Erase, S opens Status, Delete removes the selected organism or arrow and Esc clears the selection.
- Organisms are buttons: Tab to one, move it with the arrow keys (Shift for bigger steps), and with the Arrow tool press Enter on the food, then on the eater.
- On a phone, one finger on the habitat scrolls the page; one finger on an organism moves or links it. Organisms are added from the Add tab of the controls.
- Right-click the board or the pyramid to save it as an image or copy your results.
Food chains and food webs: build one and watch the energy flow
A food chain shows who eats whom in an ecosystem, and so the path that energy takes from the sun through living things. This free food chain builder lets you make your own. Drag organisms from a meadow, an ocean, a pond, a forest, the African savanna, the Arctic or a desert onto the board, draw arrows from each food to whatever eats it, and the simulator does the ecology: it names the trophic levels, counts the food chains in your web, shows the energy flowing and draws the pyramids. Then run your ecosystem forward in time and find out what happens when one species disappears.
- Habitats
- Meadow, ocean, pond, forest (Yellowstone), African savanna, Arctic tundra and sea, desert: about 120 organisms
- You build
- Food chains and food webs, by dragging organisms and drawing arrows
- It shows
- Roles, trophic levels, every food chain, energy flow and heat loss, pyramids of numbers, biomass and energy
- It runs
- Populations over time, trophic cascades, drought and disease, decomposers, DDT biomagnification, predator–prey cycles
- Modes
- Simulate (with a guided tour), Experiment (7 labs) and Quiz
- Price
- Free, with no account or download; works on Chromebooks, tablets and phones
What is a food chain?
A food chain is one path of feeding relationships, written with arrows that point from the food to the eater: grass → grasshopper → frog → snake → hawk. The arrow means "is eaten by" and shows the direction in which energy and matter flow. Every food chain starts with a producer: a plant, alga or phytoplankton cell that captures light energy by photosynthesis and stores it in sugars. The organisms that eat are consumers. A primary consumer eats producers, a secondary consumer eats primary consumers, a tertiary consumer eats secondary consumers, and the animal at the end of the chain, which nothing else eats, is the top or apex predator.
| Trophic level | Role | Meadow | Ocean | Desert |
|---|---|---|---|---|
| 1 | Producer (autotroph) | Grass | Phytoplankton | Desert flowers and seeds |
| 2 | Primary consumer (herbivore) | Grasshopper | Zooplankton | Kangaroo rat |
| 3 | Secondary consumer | Frog | Herring | Rattlesnake |
| 4 | Tertiary consumer | Snake | Seal | Red-tailed hawk |
| 5 | Quaternary consumer | Hawk | Shark | — |
Producers, consumers and decomposers
Producers are autotrophs: they make their own food. Consumers are heterotrophs and are grouped by what they eat: herbivores eat only plants or algae (rabbit, zebra, krill), carnivores eat other animals (fox, lion, shark) and omnivores eat both (field mouse, grizzly bear, raccoon). An omnivore can sit at more than one trophic level: a mouse that eats seeds is a primary consumer, and the same mouse eating a grasshopper is a secondary consumer. The simulator shows this as a fractional trophic level, such as 2.5. Decomposers, mainly bacteria and fungi, feed on dead remains and waste from every level and release their nutrients back into the soil or water for producers to use again; detritivores such as earthworms and dung beetles help by breaking the dead matter up. Leave the decomposers off the board, run the ecosystem, and watch the dead matter pile up while the plants slowly run short of nutrients.
Food chain vs food web
Real animals rarely eat just one thing. A food web is all the food chains of an ecosystem linked together. The meadow web in the picture holds more than thirty separate food chains, and the simulator counts them for you. A food web shows interdependence: every species depends on others for food, and is food for others in turn. That is why removing one species can affect many more. When wolves were removed from Yellowstone National Park in the 1920s, elk became more numerous and grazed the willows along the rivers, so beavers, which need willow, almost disappeared. After wolves were brought back in 1995, the willows and beavers began to recover. This chain of knock-on effects through the levels is a trophic cascade. Sea otters do the same in kelp forests: they eat sea urchins, which would otherwise graze the kelp to bare rock. A species whose effect on its ecosystem is far larger than its numbers suggest is a keystone species. Try both in the simulator: remove the predator, run it for twenty years and watch the graph.
Energy flow and the 10% rule
Energy enters almost every ecosystem as sunlight, but producers fix only about 1 to 2 % of the light that reaches them; the rest is reflected, passes through or is the wrong wavelength. From then on, energy flows one way through the food chain and is lost at every step. An animal uses most of the energy in its food to stay alive: it is released by respiration and lost as heat (for movement and keeping warm), some is lost in feces and urine, and parts of its food such as roots, bones and fur are never eaten. Only the energy built into new body tissue can pass to the next level. This transfer efficiency is usually between 5 and 20 %, about 10 % on average (Lindeman's "10 percent law"):
energy at the next level ≈ 10 % × energy at this level · efficiency = energy passed on ÷ energy taken in × 100 %
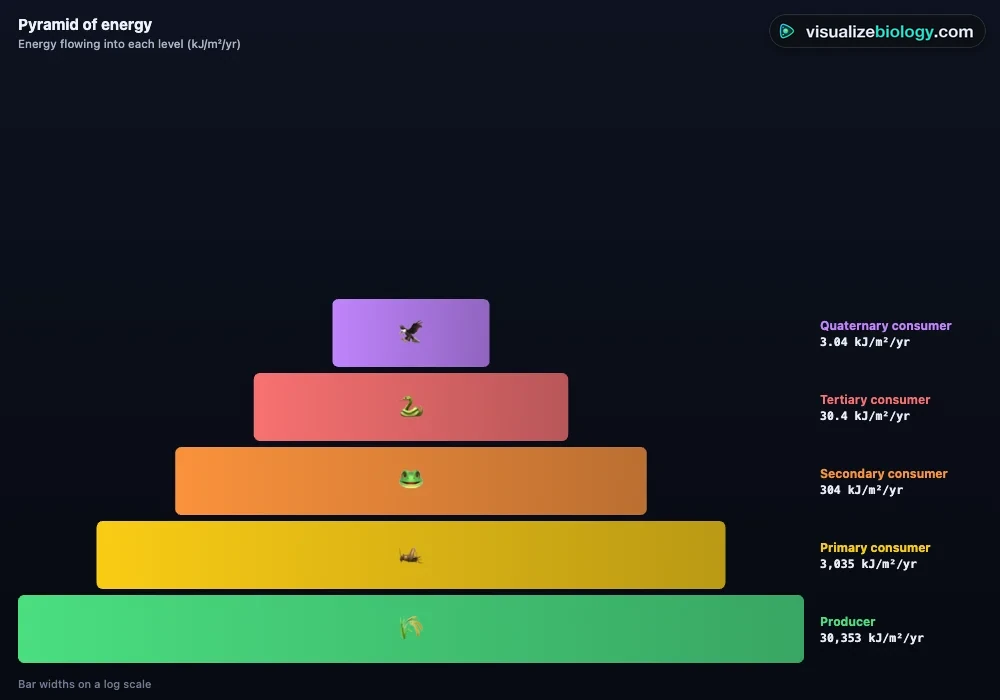
If grass fixes 36,000 kJ of energy per square meter in a year, grasshoppers get about 3,600 kJ, frogs 360 kJ, snakes 36 kJ and hawks only 3.6 kJ. That is why there are so few top predators and why food chains rarely have more than four or five links: there is not enough energy left to support another level. In the simulator the orange heat wisps show this loss, the Energy view adds it up level by level, and the transfer efficiency slider lets you see what a world with 5 % or 20 % would look like.
Ecological pyramids: numbers, biomass and energy
An ecological pyramid stacks the trophic levels as bars, producers at the bottom. A pyramid of numbers counts the organisms at each level. It is usually a pyramid, but one large oak tree can feed thousands of caterpillars, so a woodland pyramid of numbers can be inverted at the bottom. A pyramid of biomass shows the mass of living material at each level and avoids the problem of very different sizes. It is almost always upright, but in the open ocean the phytoplankton are eaten so fast that at any moment there can be less phytoplankton than zooplankton: an inverted pyramid of biomass. A pyramid of energy shows the energy flowing through each level per year, and it can never be inverted, because no level can take in more energy than the level below it gives it. Switch between the three in the Pyramid view, on a true or a log scale.
Biomagnification: how DDT moved up the food chain
Some pollutants are not broken down by living things and dissolve in fat rather than water, so they stay in the body. The insecticide DDT and mercury are the classic examples. Each organism keeps the poison from everything it eats over its lifetime, so the concentration rises at each level: biomagnification. In a Long Island estuary in the 1960s, Woodwell and colleagues measured about 0.00005 ppm of DDT in the water, 0.04 ppm in plankton, about 1 ppm in small fish and over 20 ppm in fish-eating birds such as ospreys. At those levels the birds laid eggs with thin shells that broke under the parents, and ospreys, bald eagles and peregrine falcons crashed. DDT was banned for farm use in the United States in 1972 and the birds recovered. Spray DDT in the simulator's pond and follow it up the chain in the DDT view. Mercury does the same in ocean food chains, which is why large predatory fish such as tuna and swordfish carry the most.
Predator–prey cycles
Fur trappers' records from the Hudson's Bay Company show that the numbers of snowshoe hares and the lynx that hunt them rose and fell together for nearly a hundred years, with a cycle of about ten years. When hares are plentiful, more lynx survive and breed; the growing lynx population eats more hares, so hare numbers fall; then lynx starve and decline, and the hares recover. The lynx peaks come a year or two after the hare peaks. The predator–prey lab runs this cycle with a two-species model so you can measure the period and the lag yourself.
Experiments and course links
| Lab | What you find out | Course links |
|---|---|---|
| Build and label a food chain | Producer, primary, secondary and tertiary consumers; energy left at the top | NGSS MS-LS2-3; GCSE 4.7.4.2; NCERT Class 10 |
| A food web from field notes | Turn observations into a web; omnivores and food chains | MS-LS2-2; AP Biology 8.5 |
| Energy transfer and the 10% rule | Measure energy at each level and calculate efficiency | HS-LS2-4; AP Biology 8.2 |
| Pyramids of numbers and biomass | Survey a woodland; why the numbers pyramid is inverted | GCSE 4.7.4.3; NCERT Class 12 |
| The wolves of Yellowstone | Remove and reintroduce a top predator: a trophic cascade | HS-LS2-6; AP Biology 8.7 |
| Hare and lynx cycles | Read the period and the lag of a predator–prey cycle | AP Biology 8.3–8.4; HS-LS2-1 |
| DDT in a pond | Sample each level and calculate the biomagnification | HS-LS2-7; NCERT Class 10 biological magnification |
Who uses this food chain builder?
Students use it to build and check their own food chains and webs, to learn the words (producer, consumer, trophic level, apex predator, decomposer), and to practice energy and pyramid calculations with worked answers. Teachers project the guided tour, ask the class to predict what will happen before removing a species, and set the labs as homework. It is an educational model built from published ecology, it needs no login and it runs on school Chromebooks.
Frequently asked questions
What is a food chain?
A food chain is a single path that energy and matter take through an ecosystem, from one organism to the one that eats it. It starts with a producer (a plant or alga that makes food by photosynthesis), then a primary consumer (a herbivore) that eats it, a secondary consumer that eats the herbivore, and so on up to a top predator. For example: grass → grasshopper → frog → snake → hawk. The arrows point from the food to the eater, the direction energy flows.
What is the difference between a food chain and a food web?
A food chain is one straight line of who eats whom. A food web is all the food chains in an ecosystem joined together, because most animals eat more than one kind of food and are eaten by more than one predator. A food web shows interdependence better: if one species disappears, the web shows every other species that is affected, while a single chain can make the effect look simpler than it is.
Why is only about 10% of energy passed to the next trophic level?
Most of the energy an organism takes in is used to stay alive rather than to grow. It is released by respiration and lost as heat (for movement, keeping warm and running the body), some is lost in waste such as feces and urine, and not every part of an organism is eaten (roots, bones, fur). Only the energy stored in new body tissue can be eaten by the next level, which is typically between 5% and 20%, about 10% on average. That is why food chains rarely have more than four or five links.
What are producers, consumers and decomposers?
Producers (autotrophs) make their own food from carbon dioxide and water using the energy of sunlight: plants, algae and phytoplankton. Consumers (heterotrophs) get energy by eating other organisms: herbivores eat producers, carnivores eat other animals and omnivores eat both. Decomposers, mainly bacteria and fungi, feed on dead remains and waste and release the nutrients back into the soil or water, where producers use them again. Detritivores such as earthworms help by breaking dead matter into smaller pieces.
What happens to a food web if one species is removed?
Every species linked to it is affected, and the effects can spread down the web. If a predator is removed, its prey usually increase, then eat more of their own food, which then declines: a trophic cascade. When wolves were removed from Yellowstone, elk numbers rose and they overgrazed the willows along rivers, so beavers declined; after wolves returned in 1995 the willows and beavers began to recover. If a prey species is removed, its predators must switch to other food or decline.
What is biomagnification?
Biomagnification is the increase in the concentration of a persistent poison, such as the pesticide DDT or mercury, at each step up a food chain. These chemicals dissolve in fat and are not broken down or excreted, so each predator keeps the poison from all the prey it eats in its lifetime. In a Long Island estuary in the 1960s, DDT was about 0.00005 ppm in the water but over 20 ppm in fish-eating birds, which laid thin-shelled eggs that broke.
Explore related simulators
Every food chain starts with photosynthesis: see how light, carbon dioxide and temperature limit it in the Photosynthesis Lab. Follow one of its herbivores, a caterpillar, from egg to butterfly in the Butterfly Life Cycle Simulator. Watch a single-celled predator hunt, engulf and digest its prey in the Virtual Amoeba Simulator, find phytoplankton, Daphnia and other pond life in the Virtual Microscope, and see the decomposers' smaller cousins, the viruses that infect bacteria, plants and animals, in the Virus Virtual Lab. Energy flows through a food web once, but matter cycles: follow nitrogen from the air into plants, animals and decomposers and back in the Nitrogen Cycle Simulator.
Sources: OpenStax Biology 2e, chapter 46 Ecosystems; Lindeman, Ecology 23 (1942), the trophic-dynamic aspect of ecology; Odum, Ecological Monographs 27 (1957), Silver Springs; Woodwell, Wurster and Isaacson, Science 156 (1967), DDT in a Long Island estuary; Ripple and Beschta, Biological Conservation 145 (2012), Yellowstone's trophic cascade; Estes and Palmisano, Science 185 (1974), sea otters and kelp; Williams and Martinez, Proceedings of the Royal Society B 271 (2004), trophic levels in food webs; College Board, AP Biology Course and Exam Description, Unit 8. Numbers, densities and rates are an educational model based on these sources.
Updated