
Interactive Punnett Square Calculator
Cross one, two or three genes, including sex-linked genes and blood types, and watch the square fill with real offspring: peas, flies, people. Then grow a generation and test it with a chi-square.
Your cross
Lab notebook
Every cross you make, every generation you grow and every chi-square test is written here. Export a CSV, or turn the session into a PDF lab report.
| # | Cross | What | Result | Ratio |
|---|
Concept library
Click "New problem" to begin.
Click "Start quiz" for 5 questions on monohybrid and dihybrid crosses, sex-linked traits, blood types and the chi-square test.
1 Overview
Simulate shows the Punnett square on the left and what the cross produces on the right: the offspring, the ratios, a chi-square test and the gametes. Pick an example cross in the top bar, type your own in the Cross panel, or set each parent's genotype in the Parents panel. Experiment has six labs that end in a PDF lab report, and Quiz has a practice quiz with worked solutions and a 5-question quiz.
2 Making a cross
- Type a cross such as
Rr x rr,AaBbCc x AaBbCc,XBXb x XbY(sex-linked) orIAi x IBi(blood types) and press Cross. One letter per allele, a capital for the dominant allele; write superscripts with a caret (C^R C^W). - Or choose an organism (pea, corn, fruit fly, human, snapdragon, cattle, mouse or any letters) and set up to three genes in Parents: tap a genotype for each parent. With any letters you can choose how each gene is inherited (complete or incomplete dominance, codominance or X-linked).
- ⇄ Swap parents makes the reciprocal cross: it matters for sex-linked genes.
3 Reading the square
- One parent's gametes run down the side (pink), the other's along the top (blue). ▶ fills the square box by box, flying the two alleles of each box in from their gametes; › fills one box.
- Each box is one possible offspring, drawn as the organism with its genotype. Hover over or tap a box to see its genotype, phenotype and probability, and light up every box like it. Tap a gamete to see where it goes.
- Forked line draws the same cross gene by gene and multiplies the branches (the product rule): the quick way with three genes.
4 Offspring, ratios, gametes
Offspring grows a random generation (16, 100 or 1,000), each one a box picked at random, so the counts wobble around the ratio just as real ones do. With corn, the kernels sit on an ear. Ratios compares the expected fractions (outlined bars) with what you grew (solid bars), by phenotype and genotype. Gametes shows each parent's chromosomes and the gametes meiosis can make from them, with their fractions.
5 The chi-square test
Open χ² Test. The counts of the offspring you grew are filled in for you, or type your own counts from a real lab (corn ears, fruit flies). The expected ratio comes from the square; you can change it (e.g. 9:3:3:1 or 1:1:1:1). Run χ² test shows the working, the degrees of freedom, the critical value and the p-value, and marks your χ² on the χ² distribution with the rejection region shaded.
6 Experiment mode and the lab report
Six labs: Mendel's peas (the 3 : 1 ratio), a test cross with a mystery plant, a corn-ear chi-square, Morgan's white-eyed flies, a blood-type puzzle and the product rule on a trihybrid cross. Each shows its aim, what you need and a real-lab note; the method ticks off as you work, a conclusion question checks your result, and Create lab report builds a PDF with your crosses, counts and working.
7 Quiz and units
The practice quiz covers monohybrid, dihybrid and trihybrid crosses, incomplete dominance, codominance and blood types, sex-linked traits, probability and the chi-square test, and the vocabulary, each with a worked solution. Answers can be fractions (1/4), percentages (25%) or decimals. Take the quiz gives five mixed questions and a star rating. The SI (m) | US (ft) switch changes everyday lengths such as the height of Mendel's tall pea plants (2 m is 6.6 ft).
8 Keyboard and gestures
- Space fills the square, → fills one box, B switches between the square and the forked line, G grows 100 offspring, S opens Status and Esc clears the selection.
- A plain scroll over the square or the offspring scrolls the page.
- Right-click the square or the right-hand view to save it as an image or copy the square as a table.
The Punnett square: how to predict offspring
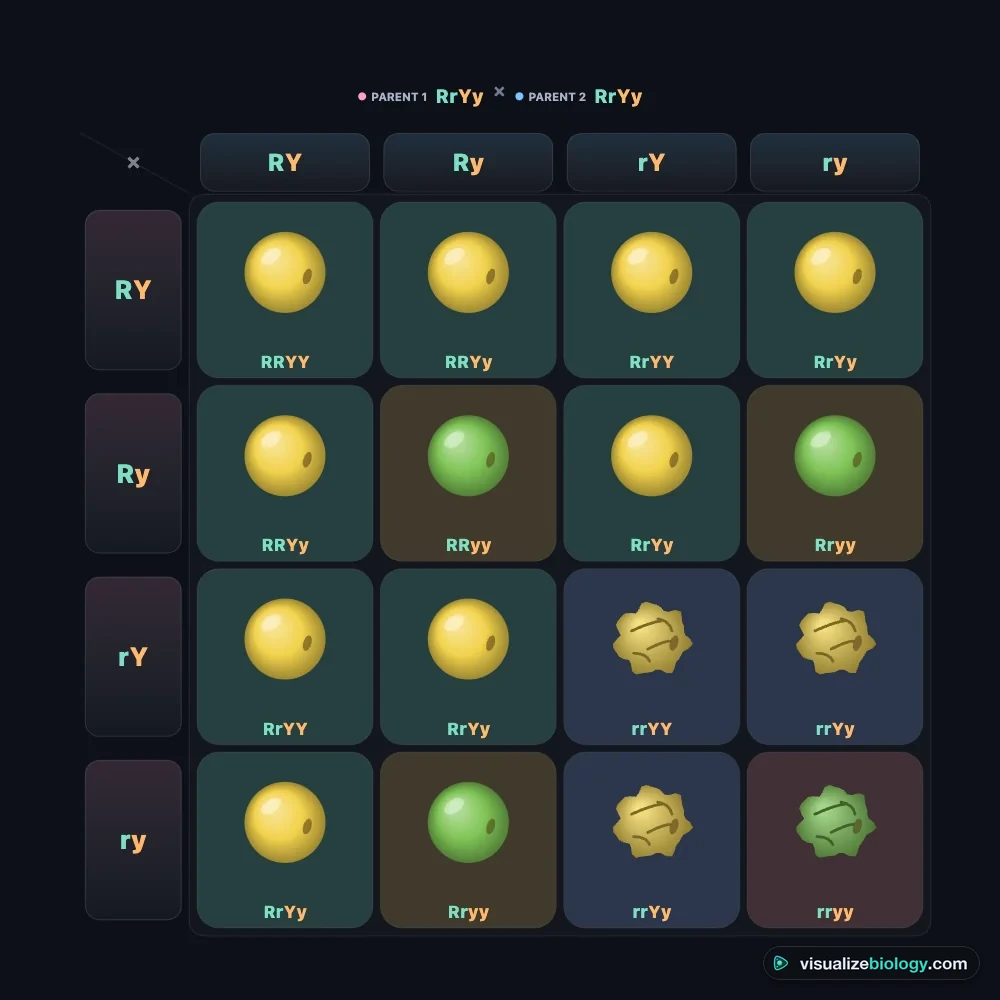
A Punnett square is a grid that shows every way two parents' alleles can combine in their offspring. The British geneticist Reginald Punnett devised it in the early 1900s to make Gregor Mendel's pea experiments easy to follow, and it is still the first tool every biology student uses to predict a genotype (the alleles an organism has) and a phenotype (the trait it shows). This calculator builds the square for one, two or three genes, draws every offspring as the organism it is, gives the ratios and probabilities, and lets you breed a generation and test it with a chi-square test.
- Crosses
- Monohybrid, dihybrid and trihybrid (2 × 2, 4 × 4 and 8 × 8 squares), test crosses, reciprocal crosses
- Inheritance
- Complete and incomplete dominance, codominance, ABO blood types, sex-linked genes, a lethal allele
- Statistics
- Ratios, probabilities, the product rule, random offspring and a chi-square test with p-value
- Modes
- Simulate, Experiment (6 labs with a PDF report) and Quiz
- Price
- Free, with no account or download; works on Chromebooks, tablets and phones
How to do a Punnett square
- Write the parents' genotypes. Use a capital letter for the dominant allele and a small letter for the recessive one: a heterozygous round-seeded pea is Rr.
- List each parent's gametes. Every gamete gets one allele of each gene (Mendel's law of segregation): Rr makes R and r. With two genes, combine one allele of each: RrYy makes RY, Ry, rY and ry.
- Draw the grid. One parent's gametes go along the top and the other's down the side, so a parent with 2 gametes gives 2 rows and one with 4 gives 4 columns.
- Fill every box with the allele from its row and the allele from its column. Each box is one possible offspring, and every box is equally likely.
- Count the boxes of each genotype and each phenotype. That gives the ratios, and a box count over the total gives a probability: 1 box in 4 is 1/4, or 25 %.
Monohybrid cross: the 3 : 1 ratio
A monohybrid cross follows one gene. Mendel crossed true-breeding round-seeded peas (RR) with wrinkled ones (rr): every seed in the first generation was Rr and round, because round is dominant. When he crossed those hybrids (Rr × Rr), the square gives 1 RR : 2 Rr : 1 rr, so 3 round : 1 wrinkled. He counted 5,474 round and 1,850 wrinkled seeds, a ratio of 2.96 : 1. A test cross with the recessive homozygote (rr) tells you whether a dominant-looking parent is RR (all offspring dominant) or Rr (half and half).
Dihybrid cross and the 9 : 3 : 3 : 1 ratio
A dihybrid cross follows two genes at once. If the genes are on different chromosomes, they are sorted into gametes independently, so a parent heterozygous for both makes four kinds of gamete in equal numbers and the square has 16 boxes. Two such parents (RrYy × RrYy) give 9 round yellow : 3 round green : 3 wrinkled yellow : 1 wrinkled green, with 9 genotypes in the ratio 1 : 2 : 1 : 2 : 4 : 2 : 1 : 2 : 1. Mendel counted 315 : 108 : 101 : 32. A dihybrid test cross (RrYy × rryy) gives 1 : 1 : 1 : 1.
Trihybrid crosses and the forked-line method
With three genes each parent can make 2 × 2 × 2 = 8 gametes, and the Punnett square has 64 boxes: AaBbCc × AaBbCc gives 27 : 9 : 9 : 9 : 3 : 3 : 3 : 1. Drawing it is slow, so geneticists use the product rule: work out each gene on its own, then multiply. The chance of an aabbcc offspring is 1/4 × 1/4 × 1/4 = 1/64, and of an offspring showing all three dominant traits 3/4 × 3/4 × 3/4 = 27/64. The calculator's forked-line view draws exactly that tree beside the full square, so you can check one against the other.
Sex-linked Punnett squares
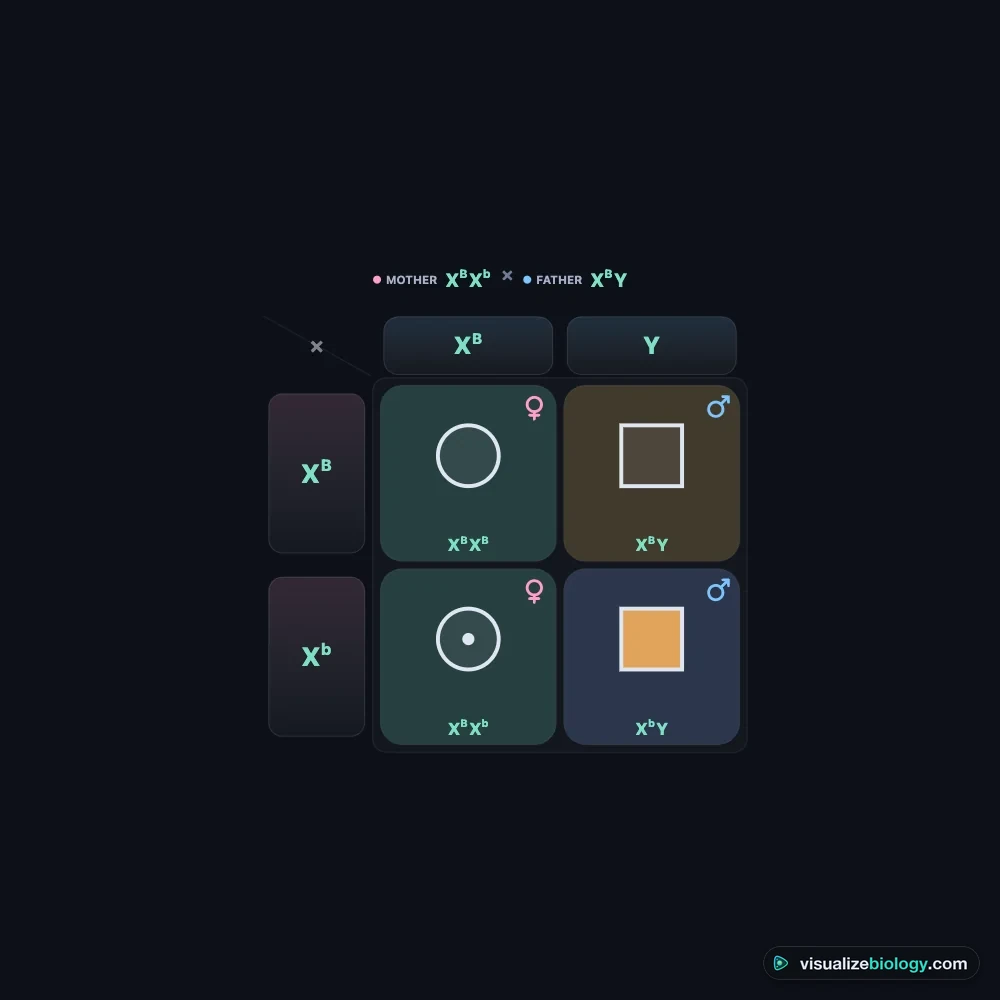
Genes on the X chromosome are sex-linked. Females have two X chromosomes and males one X and a Y, so the alleles are written on the chromosomes: a carrier woman is XBXb and a man with normal vision XBY. Their square shows that none of their daughters is red–green colour-blind (half are carriers) but each son has a 1 in 2 chance, which is why such conditions are far more common in males. Thomas Hunt Morgan found the first sex-linked gene in 1910 in fruit flies: a white-eyed male crossed with red-eyed females gave all red-eyed offspring, but in the next generation only males had white eyes.
Incomplete dominance, codominance and blood types
Not every gene has a dominant and a recessive allele. With incomplete dominance the heterozygote is in between: a red and a white snapdragon give pink flowers, and two pinks give 1 red : 2 pink : 1 white, so the phenotype ratio is the same as the genotype ratio. With codominance both alleles show fully, side by side: a roan cow has red and white hairs. Human ABO blood types combine codominance with multiple alleles: IA and IB are codominant and both are dominant to i, so a type A parent (IAi) and a type B parent (IBi) can have children of all four blood types.
The chi-square test in genetics
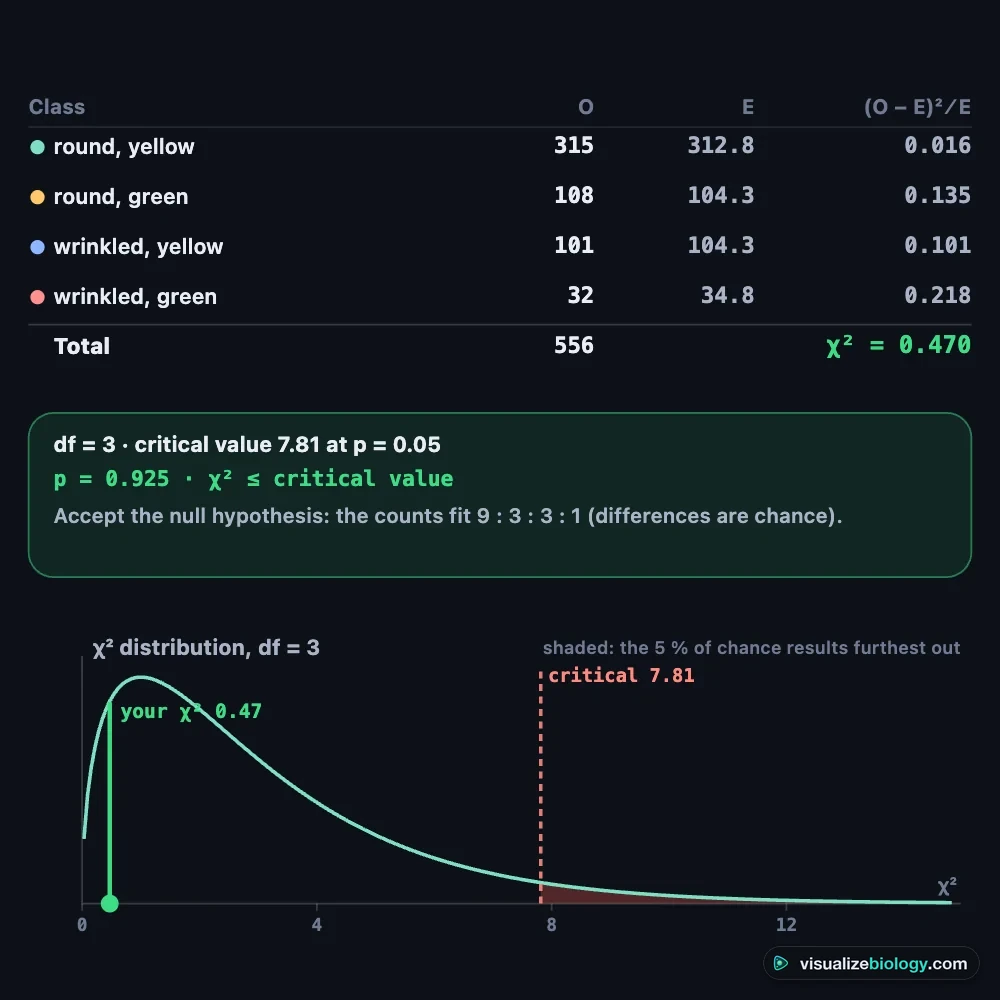
Real offspring never match a ratio exactly. The chi-square (χ²) test asks whether the difference between what you observed (O) and what you expected (E) is small enough to be chance. For each class work out (O − E)² ÷ E and add them up; the degrees of freedom are the number of classes minus one. If χ² is below the critical value, the data fit the ratio. Mendel's dihybrid counts give χ² = 0.47 against 9 : 3 : 3 : 1, far below the critical value of 7.82: an excellent fit. In the calculator you can grow a generation, or type real counts, and see your χ² marked on the χ² distribution.
| Degrees of freedom | 1 | 2 | 3 | 4 | 5 | 7 |
|---|---|---|---|---|---|---|
| p = 0.05 | 3.84 | 5.99 | 7.82 | 9.49 | 11.07 | 14.07 |
| p = 0.01 | 6.63 | 9.21 | 11.34 | 13.28 | 15.09 | 18.48 |
Experiments and course links
| Lab | What you find out | Course links |
|---|---|---|
| Mendel's peas | Why the F2 is 3 : 1, and whether Mendel's own counts fit | AP Biology 5.3; GCSE 4.6.1.6 |
| Test cross: the mystery plant | How to find a hidden genotype | NGSS HS-LS3-3; IGCSE |
| Corn ear chi-square | Is it 9 : 3 : 3 : 1 or 1 : 1 : 1 : 1? A χ² decides | AP Biology 5.3, SP 5; A-level 3.7.1 |
| Morgan's white-eyed flies | Why a trait can skip a generation and show only in males | AP Biology 5.4; A-level 3.7.1 |
| Blood-type puzzle | Codominance, multiple alleles and which parents are possible | AP Biology 5.4; GCSE; IB D3.2 |
| The product rule | Trihybrid probabilities without drawing 64 boxes | AP Biology 5.3; IB D3.2 |
Who uses this Punnett square calculator?
Middle and high school students learning genetics for NGSS, AP Biology, GCSE, IGCSE and IB; college students in introductory genetics; and teachers who want a free, no-login tool that shows why the ratios come out as they do, on a classroom screen or on students' Chromebooks. Use it to check homework, to make worked examples for any cross, or to run a chi-square on your own class data from corn ears or fruit flies.
Frequently asked questions
How do you do a Punnett square?
Write each parent's genotype, then list the gametes each parent can make: one allele of every gene, so Rr makes R and r, and RrYy makes RY, Ry, rY and ry. Put one parent's gametes along the top of a grid and the other parent's down the side. Fill each box with the allele from its row and the allele from its column; each box is one possible offspring and all boxes are equally likely. Count the boxes of each genotype and phenotype to get the ratios: Rr × Rr gives 1 RR : 2 Rr : 1 rr, so 3 round : 1 wrinkled.
What is the ratio of a dihybrid cross?
Crossing two parents heterozygous for two genes on different chromosomes (AaBb × AaBb) gives a 9 : 3 : 3 : 1 phenotype ratio: 9/16 show both dominant traits, 3/16 one dominant and one recessive, 3/16 the other way round and 1/16 both recessive. The square has 16 boxes and 9 different genotypes in the ratio 1 : 2 : 1 : 2 : 4 : 2 : 1 : 2 : 1. A dihybrid test cross (AaBb × aabb) gives 1 : 1 : 1 : 1.
How do you do a chi-square test in genetics?
Count the offspring in each phenotype class (O), and work out how many you expected from the predicted ratio (E = total × fraction, e.g. 9/16 of 556). For each class calculate (O − E)² ÷ E and add them up: that sum is χ². The degrees of freedom are the number of classes minus 1. Compare χ² with the critical value at p = 0.05 (3.84 for 1 degree of freedom, 5.99 for 2, 7.82 for 3). If χ² is smaller, accept the null hypothesis: the counts fit the ratio and the differences are due to chance. Mendel's 315 : 108 : 101 : 32 peas give χ² = 0.47, an excellent fit to 9 : 3 : 3 : 1.
Explore related simulators
See where the gametes in the square come from, and how crossing over and independent assortment shuffle the alleles, in the Meiosis Simulator. Look at the molecule the alleles are written in with the DNA Structure 3D Model, and see how one changed base turns a working allele into a disease allele, such as sickle cell, with the Interactive Codon Chart and DNA to Protein Translator. Watch chromosomes copied and shared out equally in ordinary cell division in the Mitosis Simulator.
Sources: OpenStax Biology 2e, chapter 12 (Mendel's Experiments and Heredity); Urry et al., Campbell Biology 12th edition, chapters 14 and 15; Mendel, Versuche über Pflanzen-Hybriden (1866); Morgan, Science 32 (1910); Punnett, Mendelism (1905); College Board, AP Biology Course and Exam Description, Unit 5, and the AP Biology formula sheet (chi-square table). The crosses follow Mendel's laws exactly; the random offspring and everything else are an educational model based on these sources, and nothing here is medical or genetic-counselling advice.
Updated